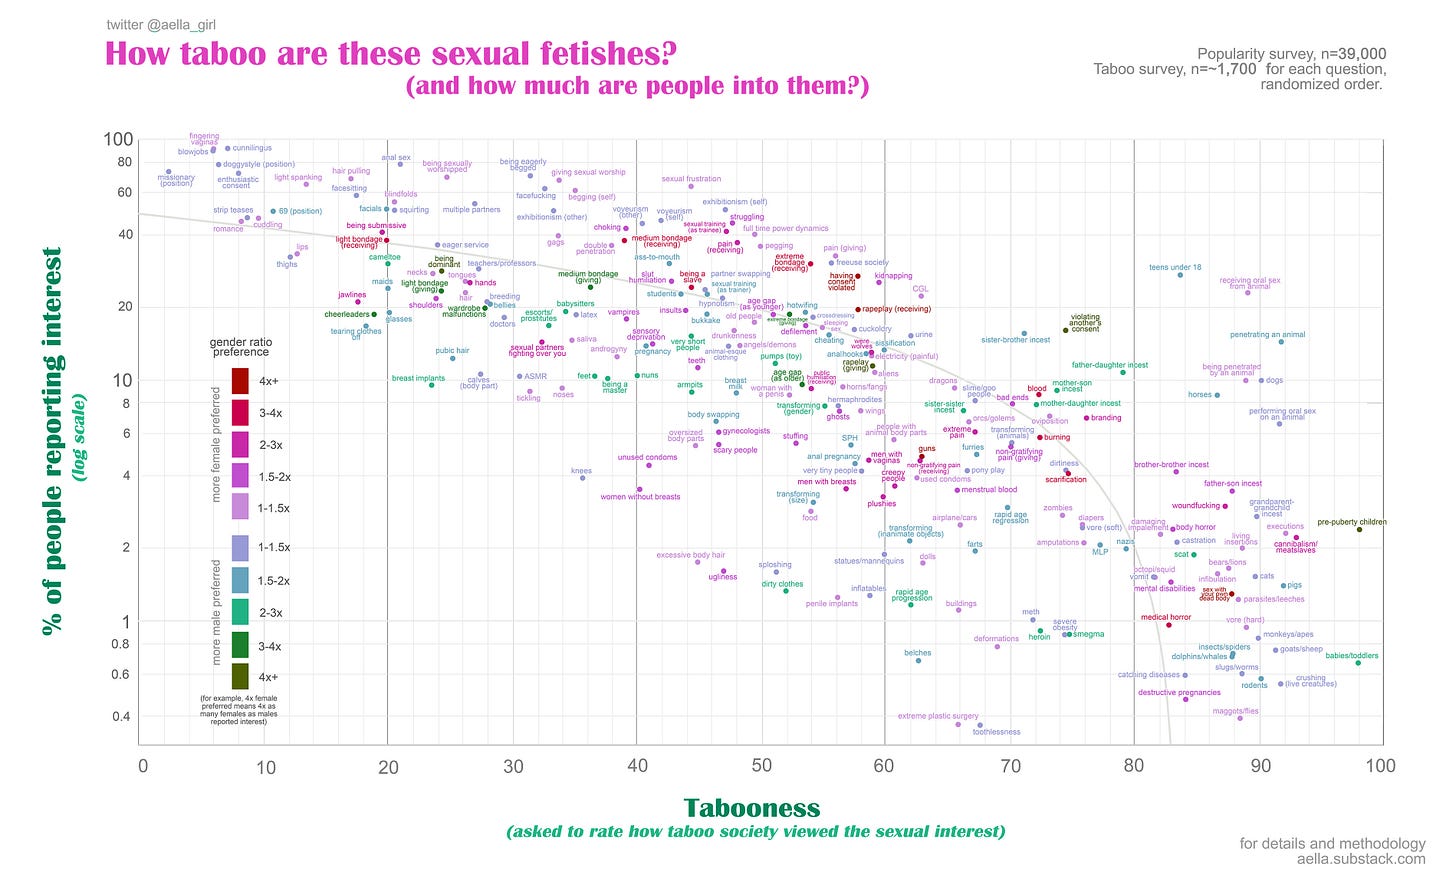
Fetish Tabooness vs Popularity
~250 fetishes, graphed for your pleasure
UPDATE: NEW, BETTER VERSION OF GRAPH HERE
Here’s results from two surveys I did, charting tabooness and popularity.
(Who took my survey, and how i constructed the survey, and raw scores here)
The tabooness survey I had people take was waay simpler, just gave people a set of questions in a random order. I asked them to rank each subject of sexual interest according to how taboo they thought society viewed the thing, with prompts like how bad would it be if “a politician’s email leaked where he was into this” or “a friend announces being into thsi on social media” or “you described being into this at a family reunion”.
I counted any interest marked in a fetish, and the numbers are binary here - just straight “what % of people marked any interest”, not adjusted for intensity of interest.
Sample size at the time I made this was around 11k females and 28k males.
Correlation is, and I swear I didn’t make this up, -0.69.
High resolution version of the chart here
I used a log scale, because linear smashed everything down at the bottom and it was hard to see.
I weighed males and females equally - as in, measured female interest in a thing, and male interest, and took the average of those two numbers. I did the same with some of the taboo ratings I had, as some of the fetishes I asked separate taboo rankings for male and female.
Some of the fetishes listed are a bit particular - for example, “mild pain” popularity was measuring people turned on exclusively by mild pain, and not severe pain (though in general, the rest of the fetishes should not be exclusive). Some of the fetishes on the graph are shortened compared to the questions given to respondents; for example, “breeding” was “breeding and impregnation.”
Fetishes marked with “other” mean the fetish was framed as happening to, directed towards, or applying to someone else; fetishes marked “self” mean the fetish was framed as happening to the reader, to yourself.
There’s a chance I made some small errors in this chart, and as other people look over the data I’ll update this post with any corrections I find.
Also, general reminder, I use the terms ‘fetish’ and ‘kink’ loosely. I know some people have particular definitions for it, but I don’t care. I’m using them as a broad term to refer to all types of sexual interest in people, actions, things, whatever.


I found this interesting on so many levels. My first reaction was to wonder why you chose a logarithmic scale. I realize that you stated that it would crush the lower percentages together. But perhaps you should consider that the difference between 3% and 5% of people being interested does not amount to very much, particularly if you take into consideration the margin of error in a poll such as this.
After that, the first thing that captured my attention was the fact that cunnilingus with actually preferred by men more than women. Given your color coding, it was somewhere between 1 and 1 1/2 times more preferred by men. Of course that means it could be preferred by men by a ratio of only 1 1/100 and it would still be in that category, despite the fact that men and women were essentially equally interested. But I would still find that notable. On the other hand, if men were 50% more interested that would raise my eyebrows (among other things)
I could go on and make a number of other comments about things I found interesting, but I'll stop with one more. The fact that fingering was the number one most popular sex act of all surprised me. I suppose that I thought that I was alone in how much of a turn on I find it to be. But apparently I have a lot of company.
yo you gotta use different colors for male/female ratio. this red-green-purple color scheme is like a humiliation task for mildly color-blind dudes.
very fascinating!