Sex Workers Are Built Different (graph dump)
Comparing different sex work types and their contrast to non-sex-workers.

This is my weekly Graph Dump, where I pull a bunch of data from one of my surveys.
Today we’re visiting my BKS (big kink survey), which is currently at 970k (roughly ~3% of which came from directly me-related channels). As a reminder, this dataset is ‘the type of people who like taking online surveys’, which tends to skew quite young (avg age ~22 i think), female (~80% female iirc), and (very!) liberal. I sometimes balance this out if it’s relevant.
I added sex work questions late, so we have a lower sample - in the low 200ks, of which ~15k reported having any sex work experience. I asked if you’d ever done sex work. If yes, I give a series of questions about subtypes of sex work. If you answer yes to those, I ask how experienced you were, and how good your experience in that sex work was.
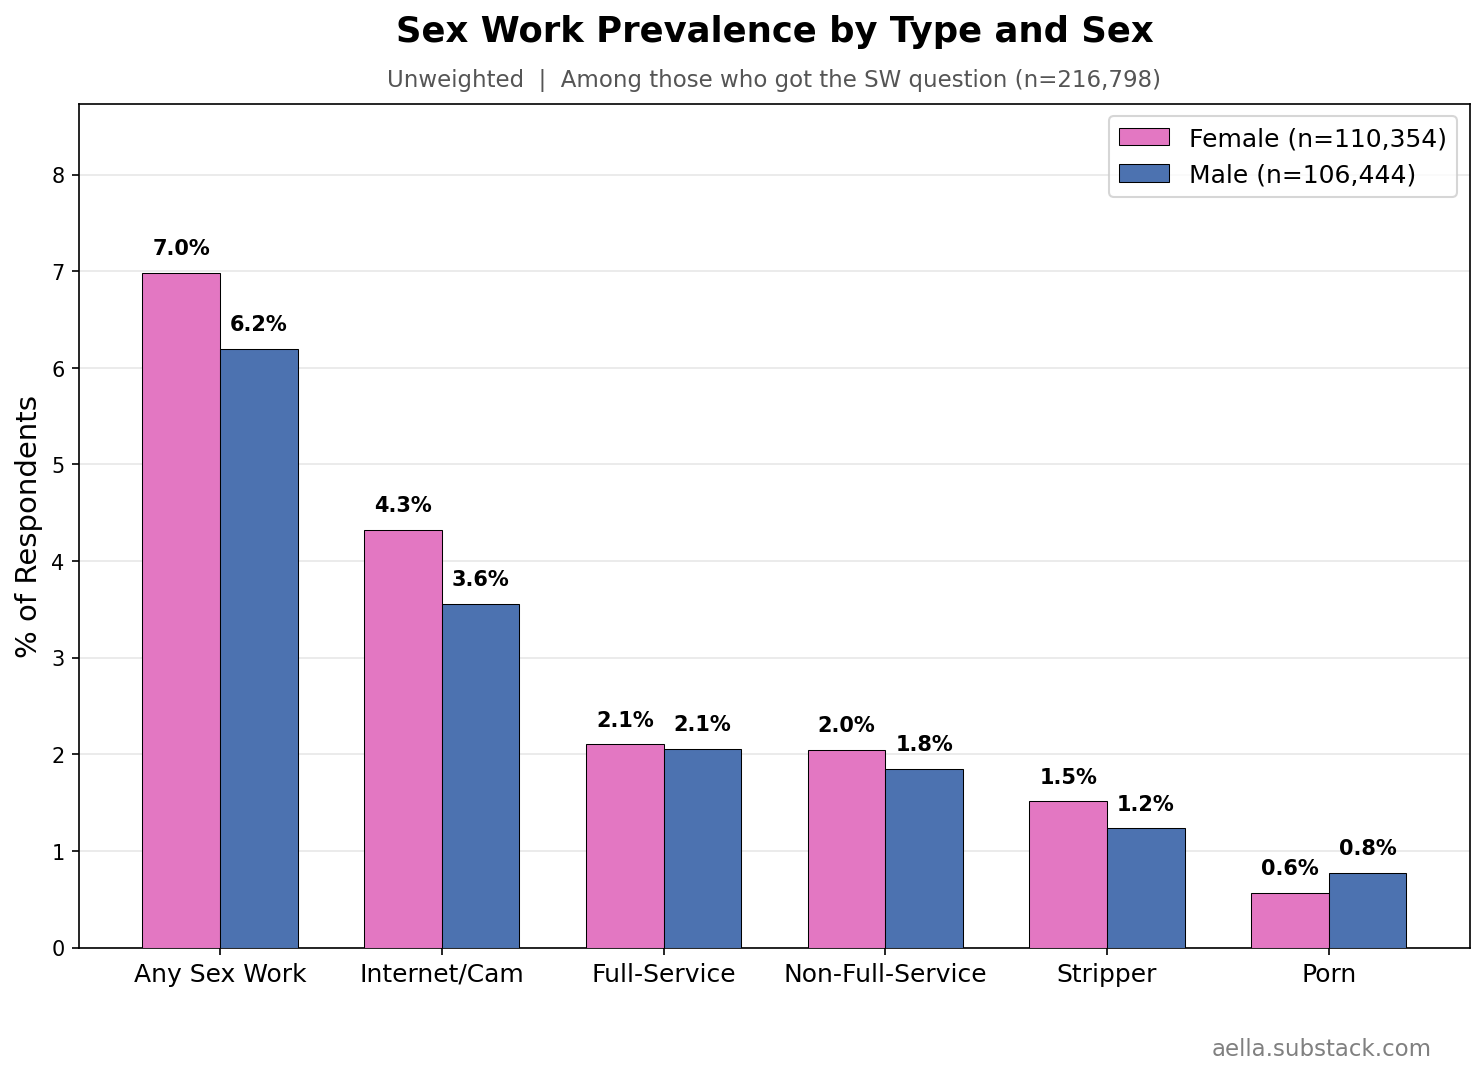
Let’s look at some basic stuff:
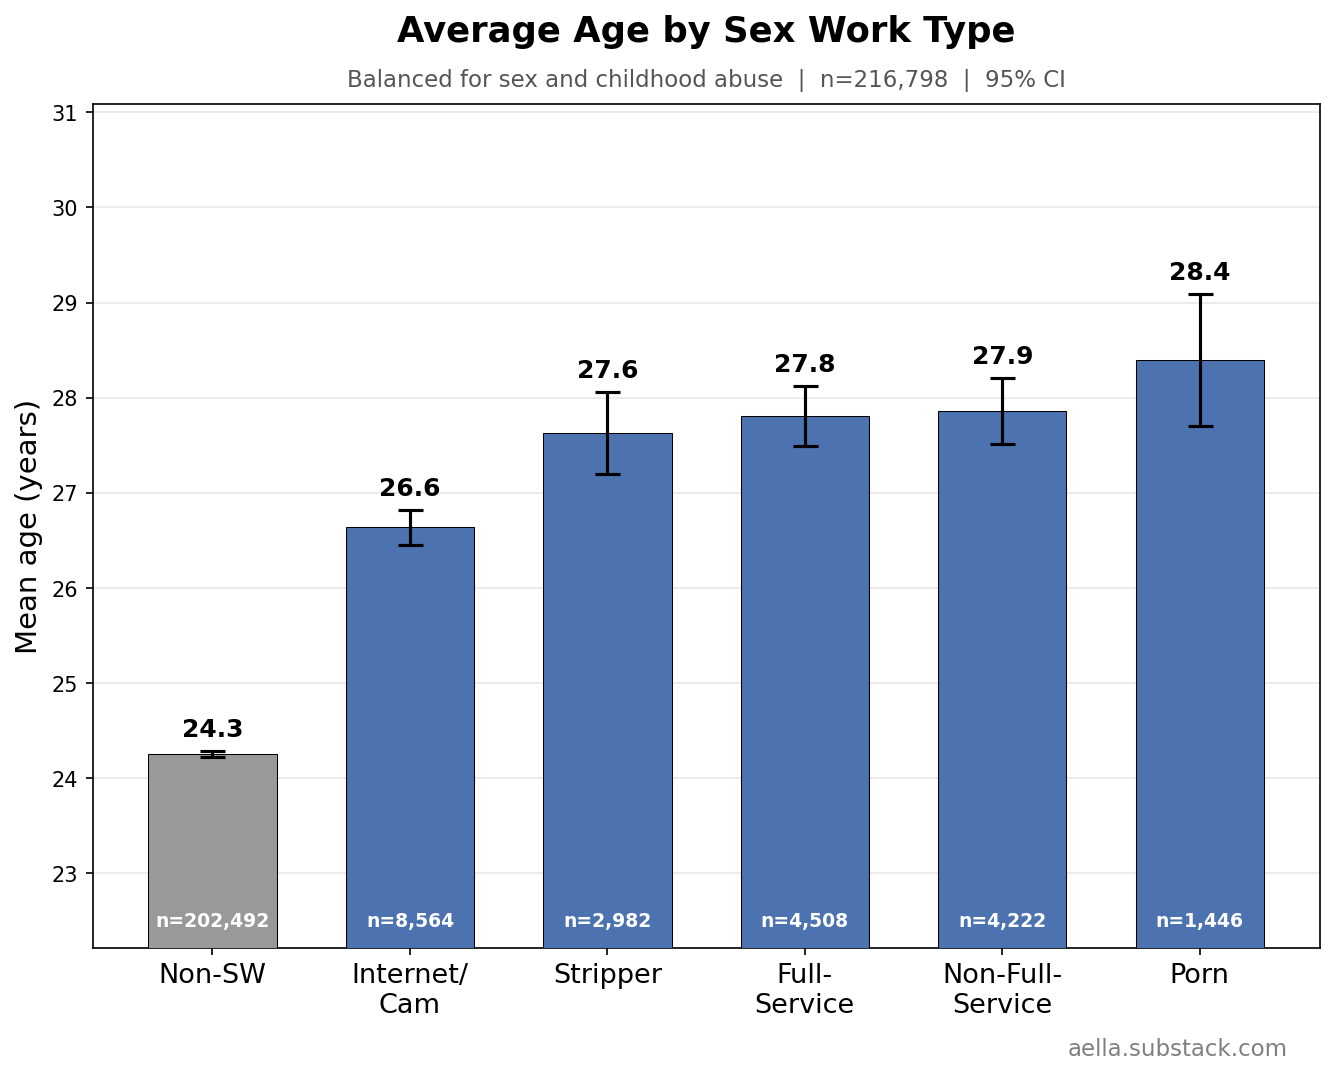
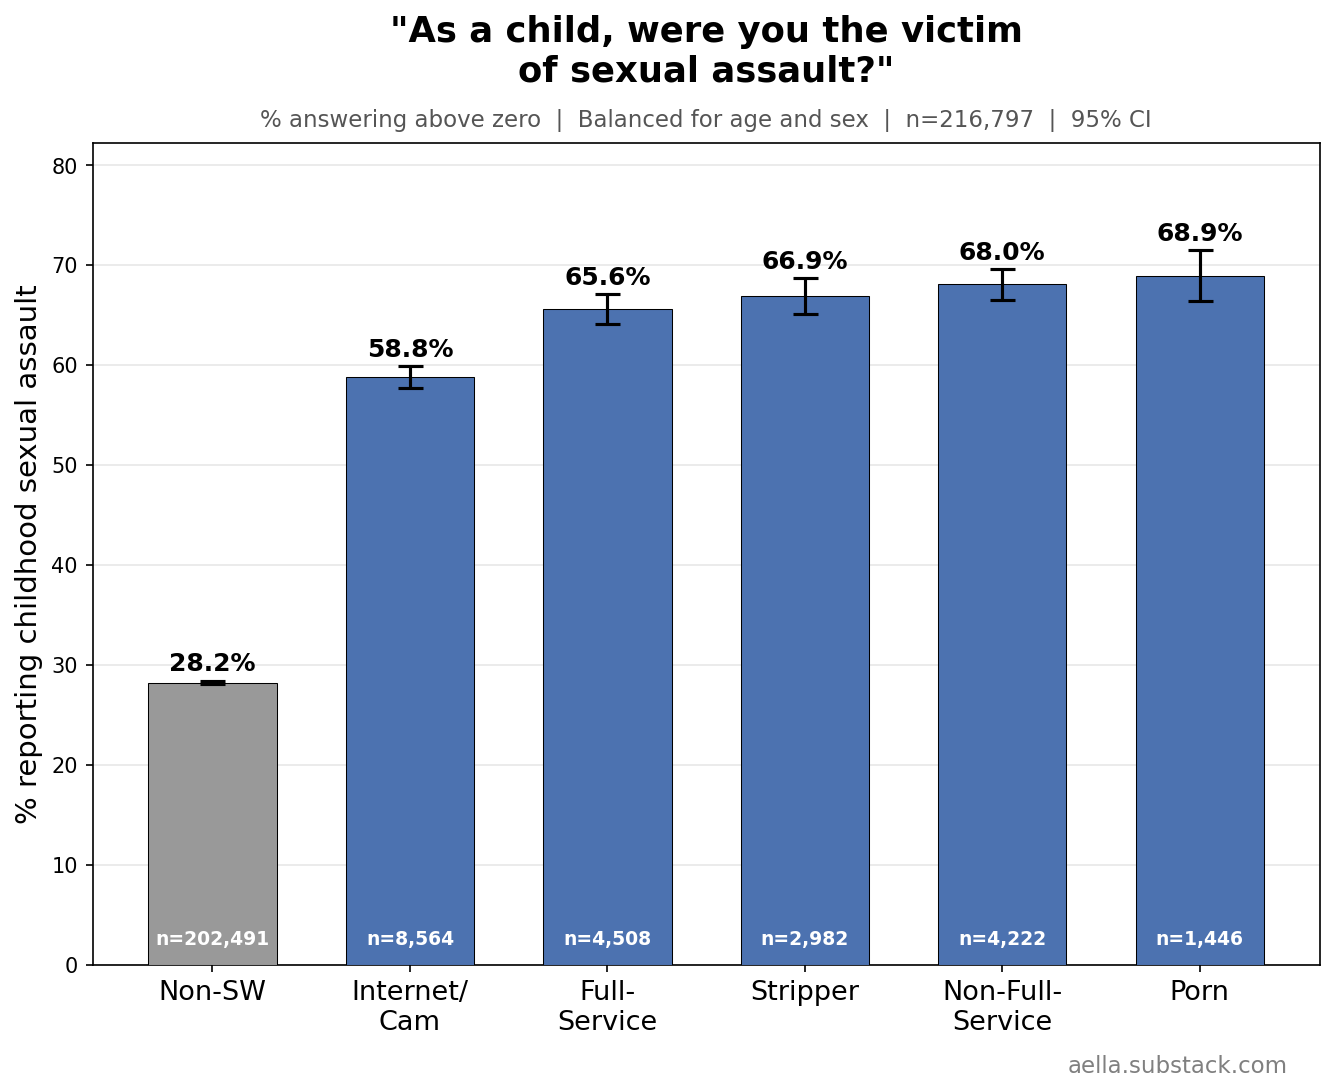
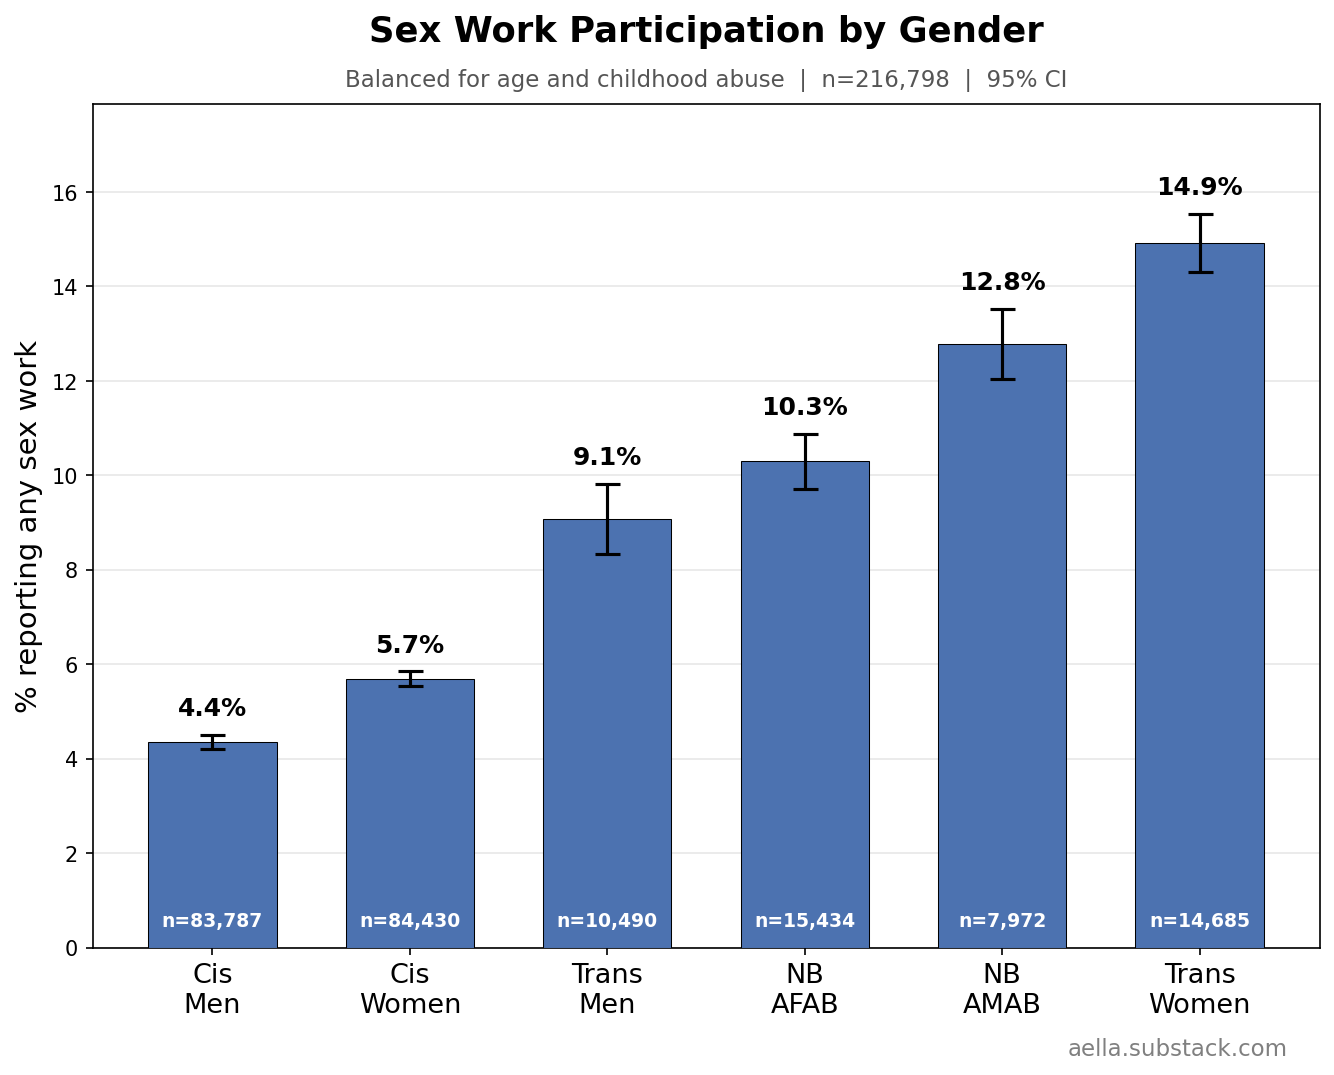
These above are things I’m gonna control for in the following graphs, since age, childhood abuse, and biological sex seem to be pretty related to stuff we’re trying to disentangle from sex work. You might argue ‘wait, childhood abuse seems weird to control for, what if we wanna know what abused sex workers get up to’ and… maybe, but I find it more interesting to know how sex workers differ from the average population independently of childhood abuse. So I’m making sure ‘any childhood abuse’ and ‘no childhood abuse’ have the same ratio across categories. Keep in mind we’ll likely still see ‘severity’ of childhood
(I’m doing my age-controls crudely. Most of my respondents are in their 20’s; sex workers are 3-4 years older than sex workers, which is not enough to impact very much. So I’m just doing a basic 3-age-bin reweight. But still, there might be very slight age-related effects still poking through)
Sex workers do tend to be more liberal:
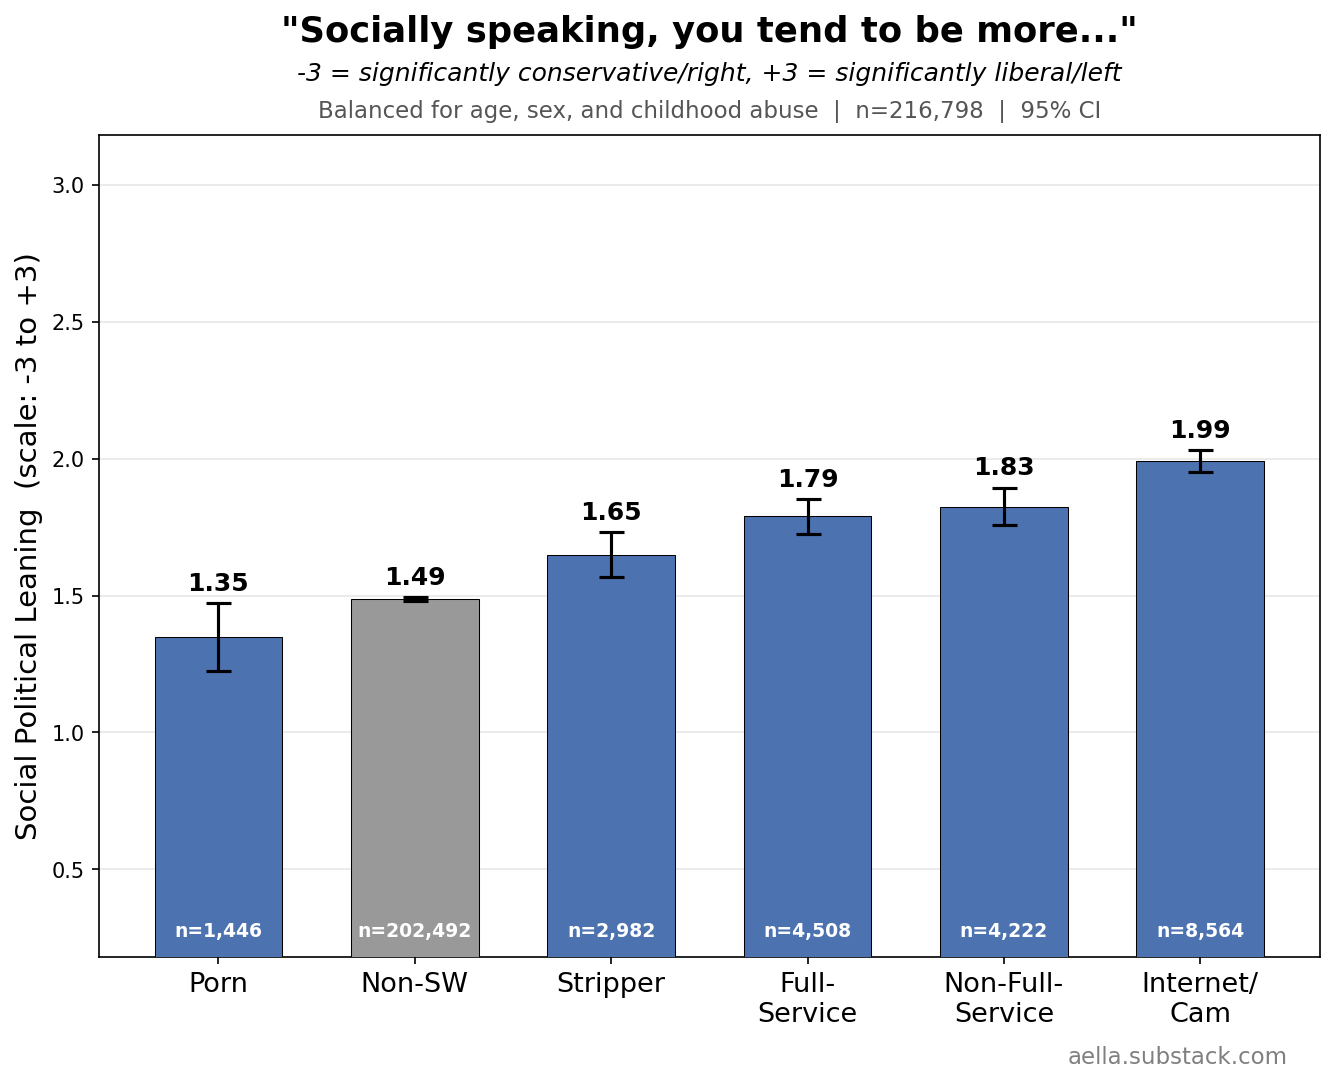
But I’m not gonna weight this because a) I’m wary of weighting for too many things, and b) my overall sample is skewed very liberal, so I don’t think conservative confounders will actually impact the data too much.
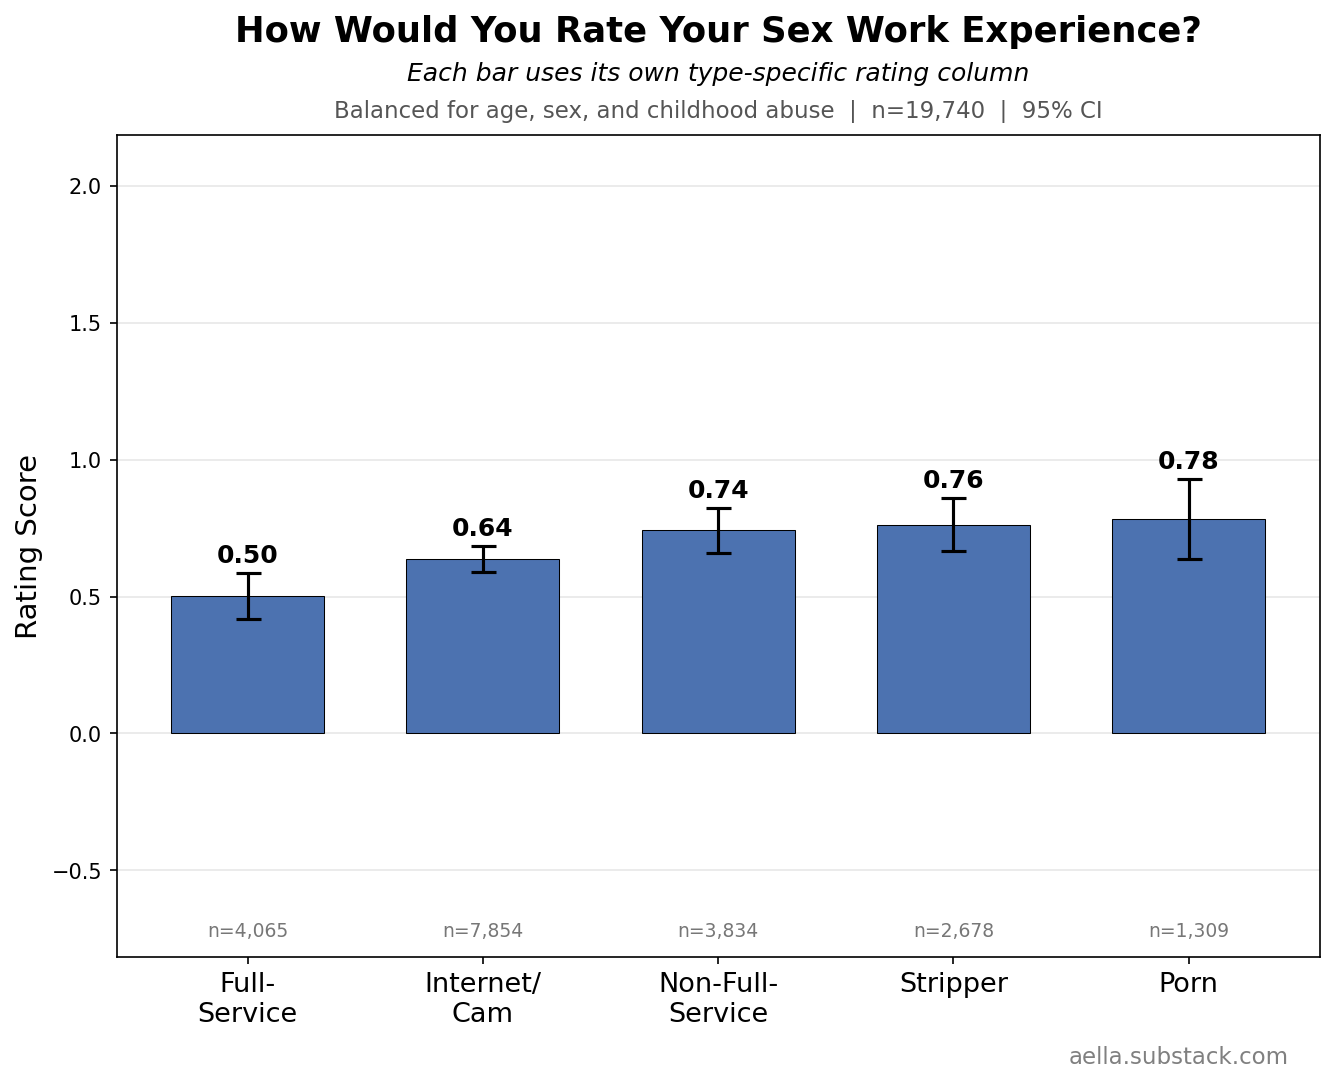
I asked people to rate their experience in their type of sex work from negative to positive. This was the averaged results: all were slightly more positive than neutral, with full-service being the lowest rated and porn being the highest - an extremely surprising reuslt for me!
Non-full-service I defined in the survey as ‘(This is any in-person sex work that DOES involve physical contact, but DOESN’T include penetration - such as a massage parlor worker or dominatrix)’
The more experience someone has in a thing, the more they like it. This makes sense. Probably people who don’t like it, quit, and thus have less experience:
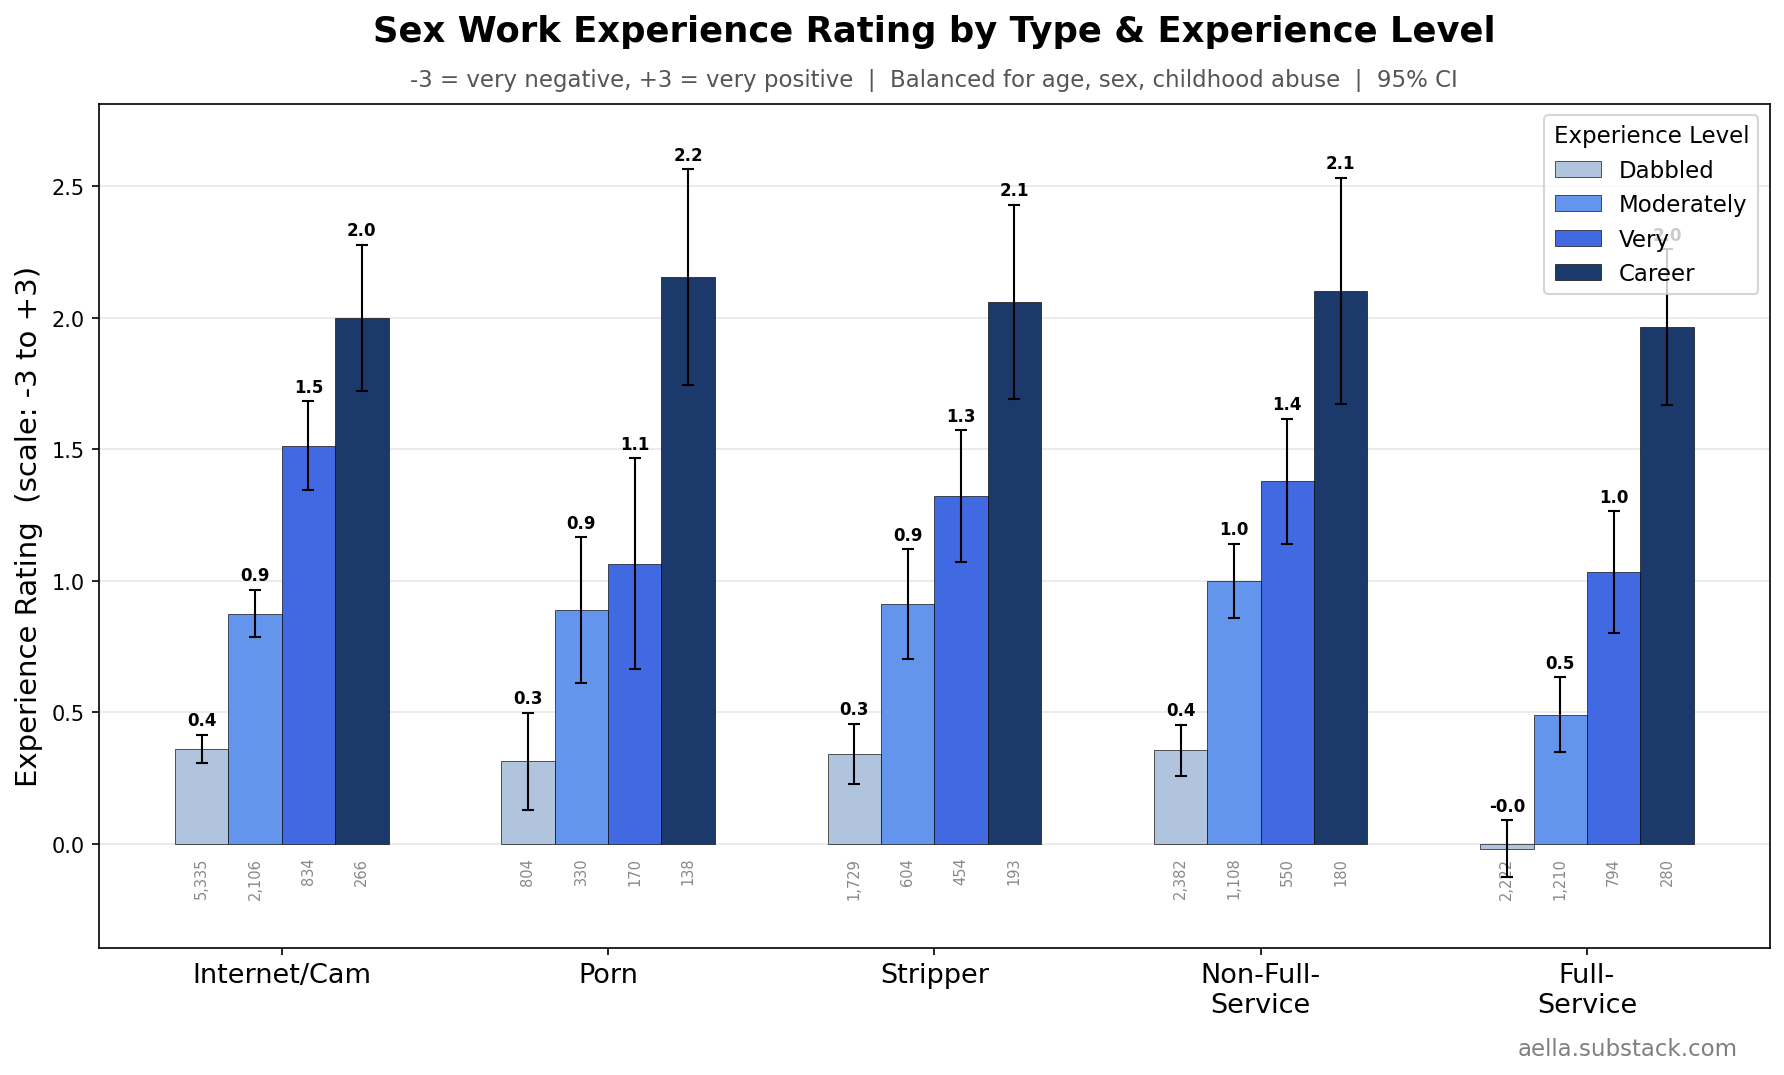
But the people who are doing sex work at a career-level have overwhelmingly positive views of their jobs! That’s nice to see.
Since this is supposed to be a graph dump, I’m gonna just dump the rest of the graphs here without commentary unless I can’t help but provide commentary:
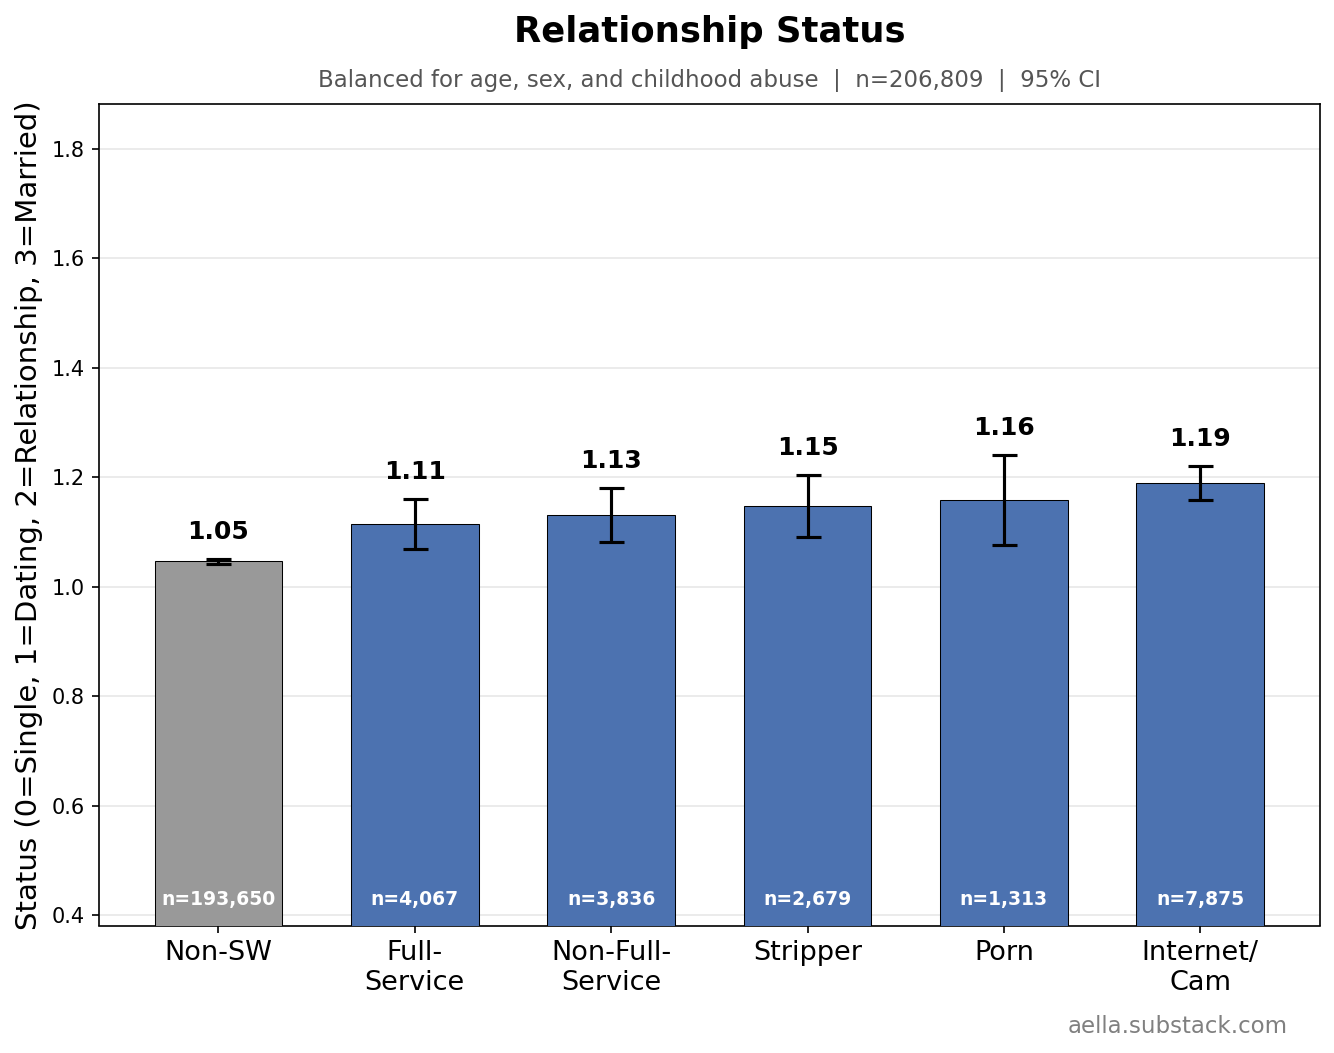
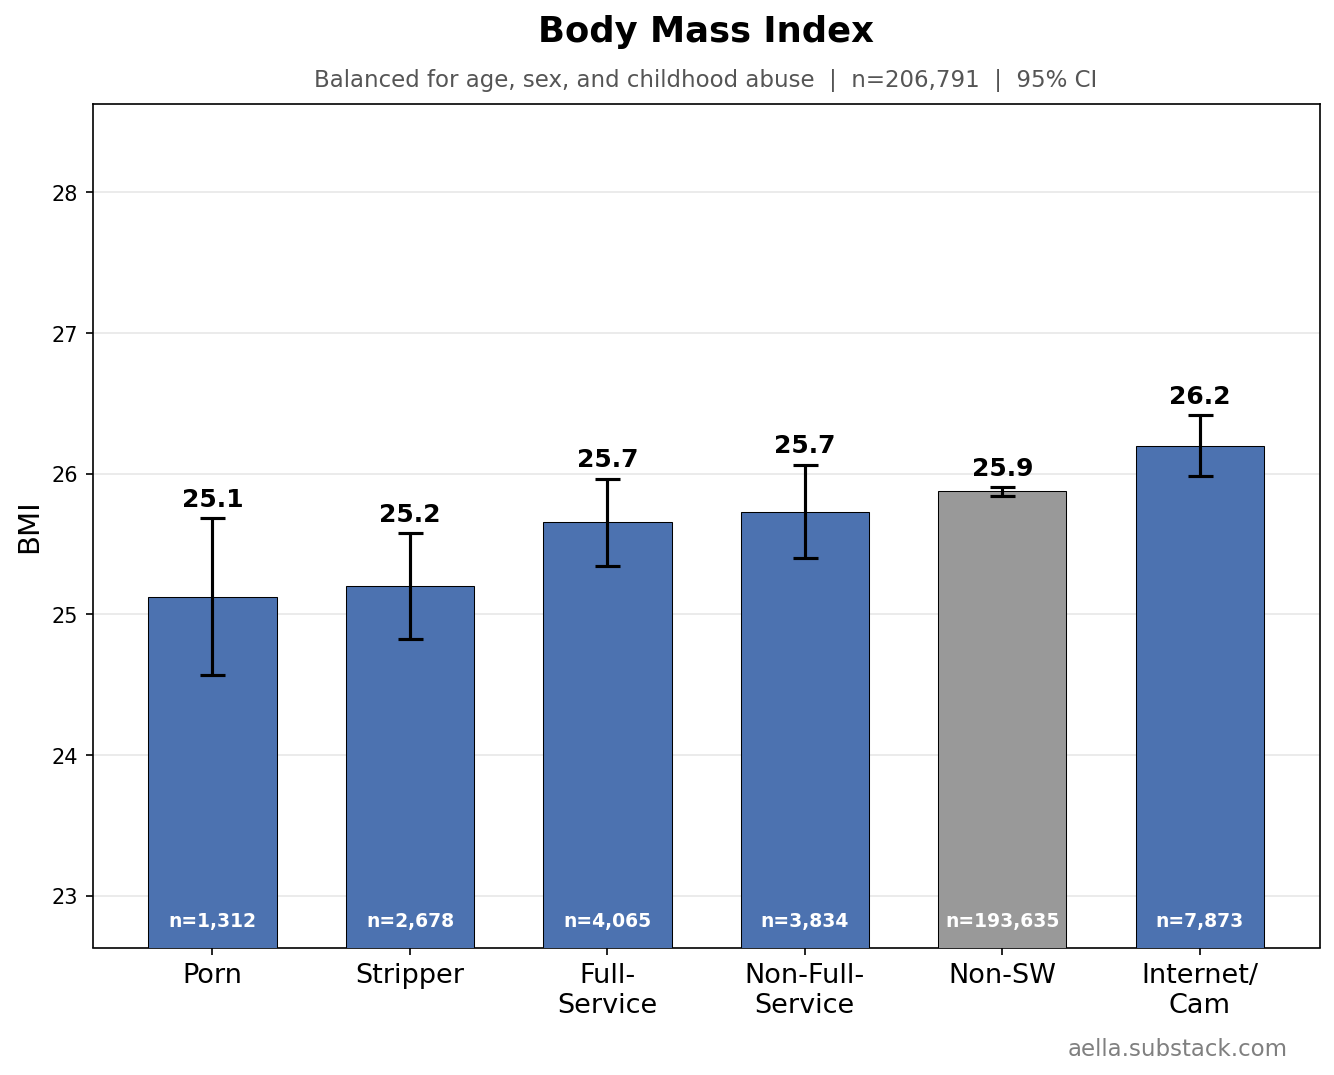
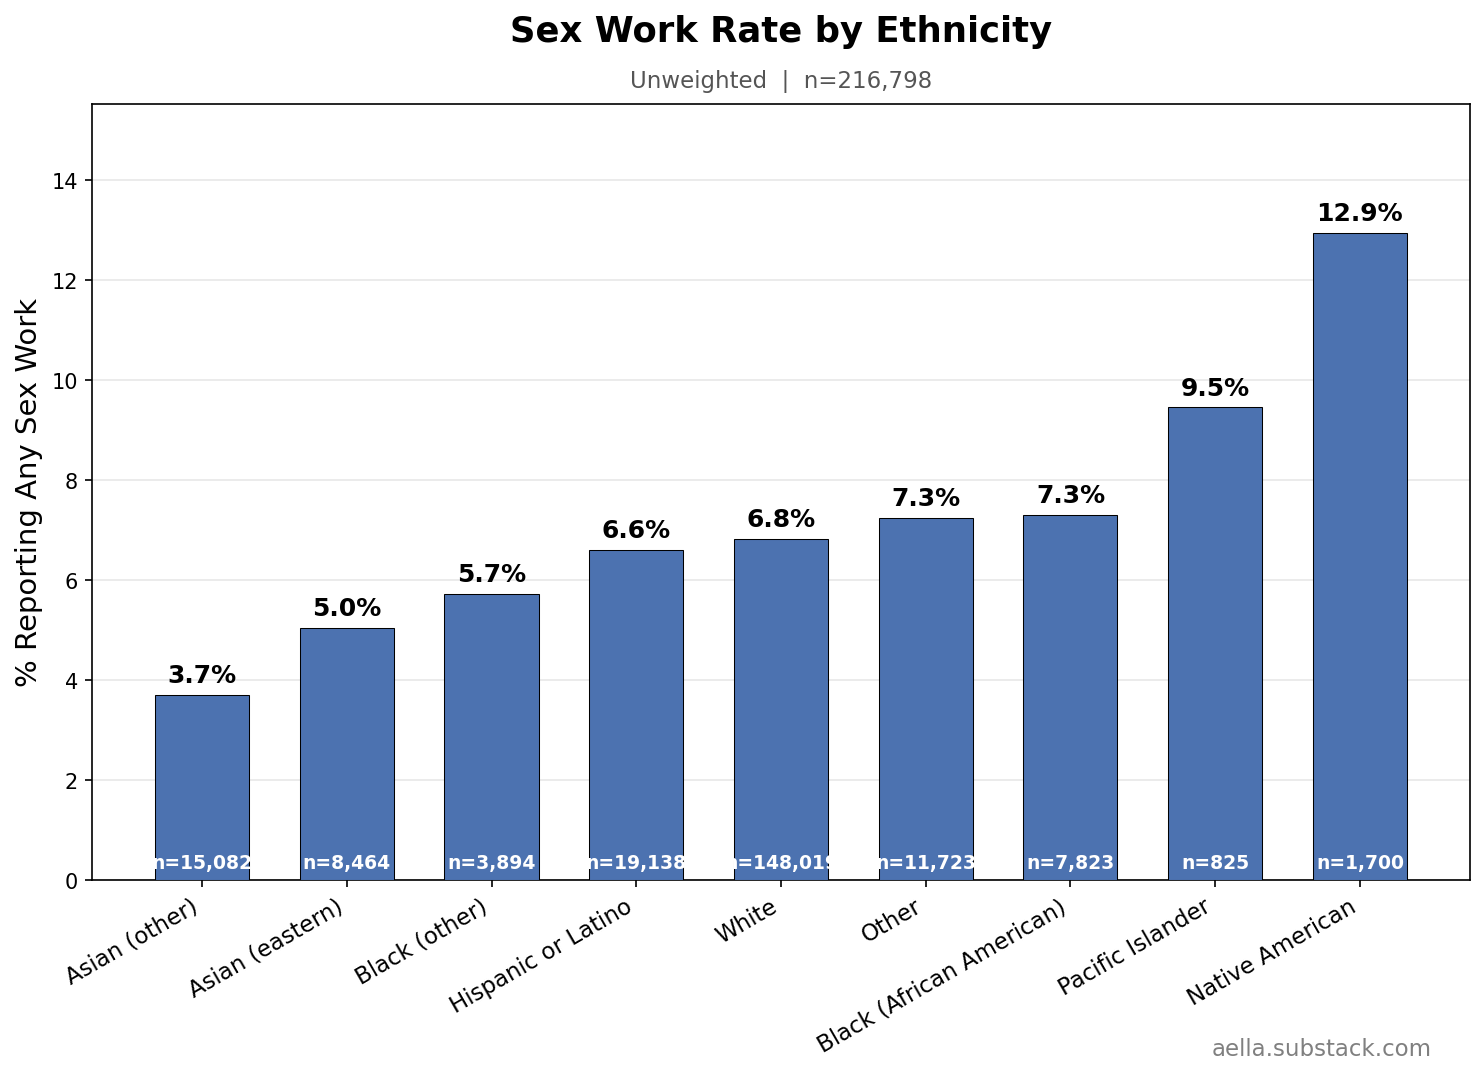
Demographicy Stuff
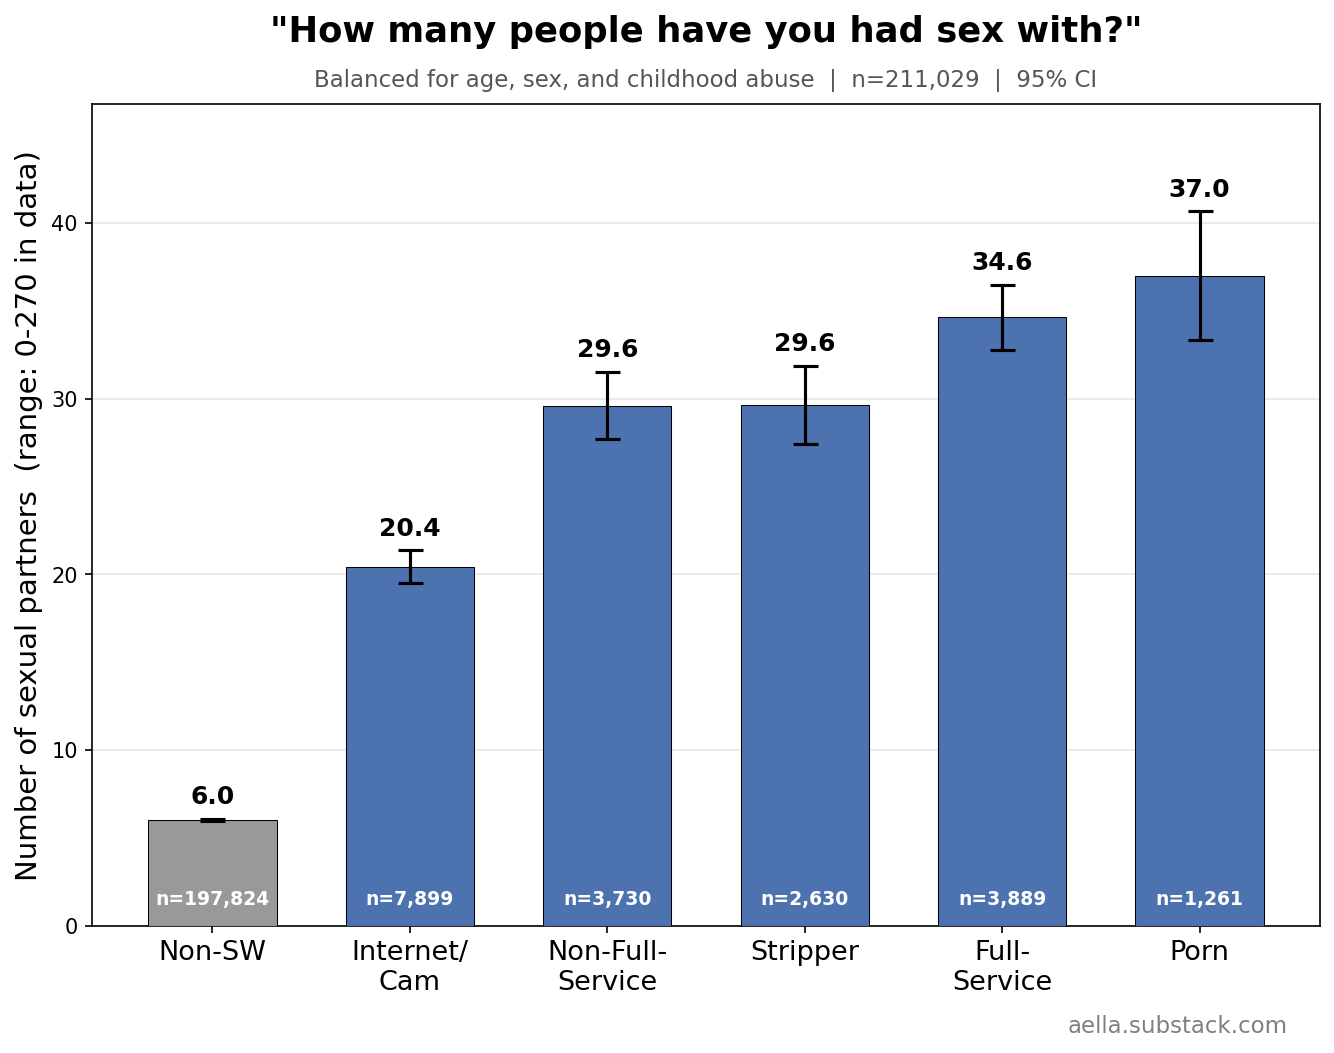
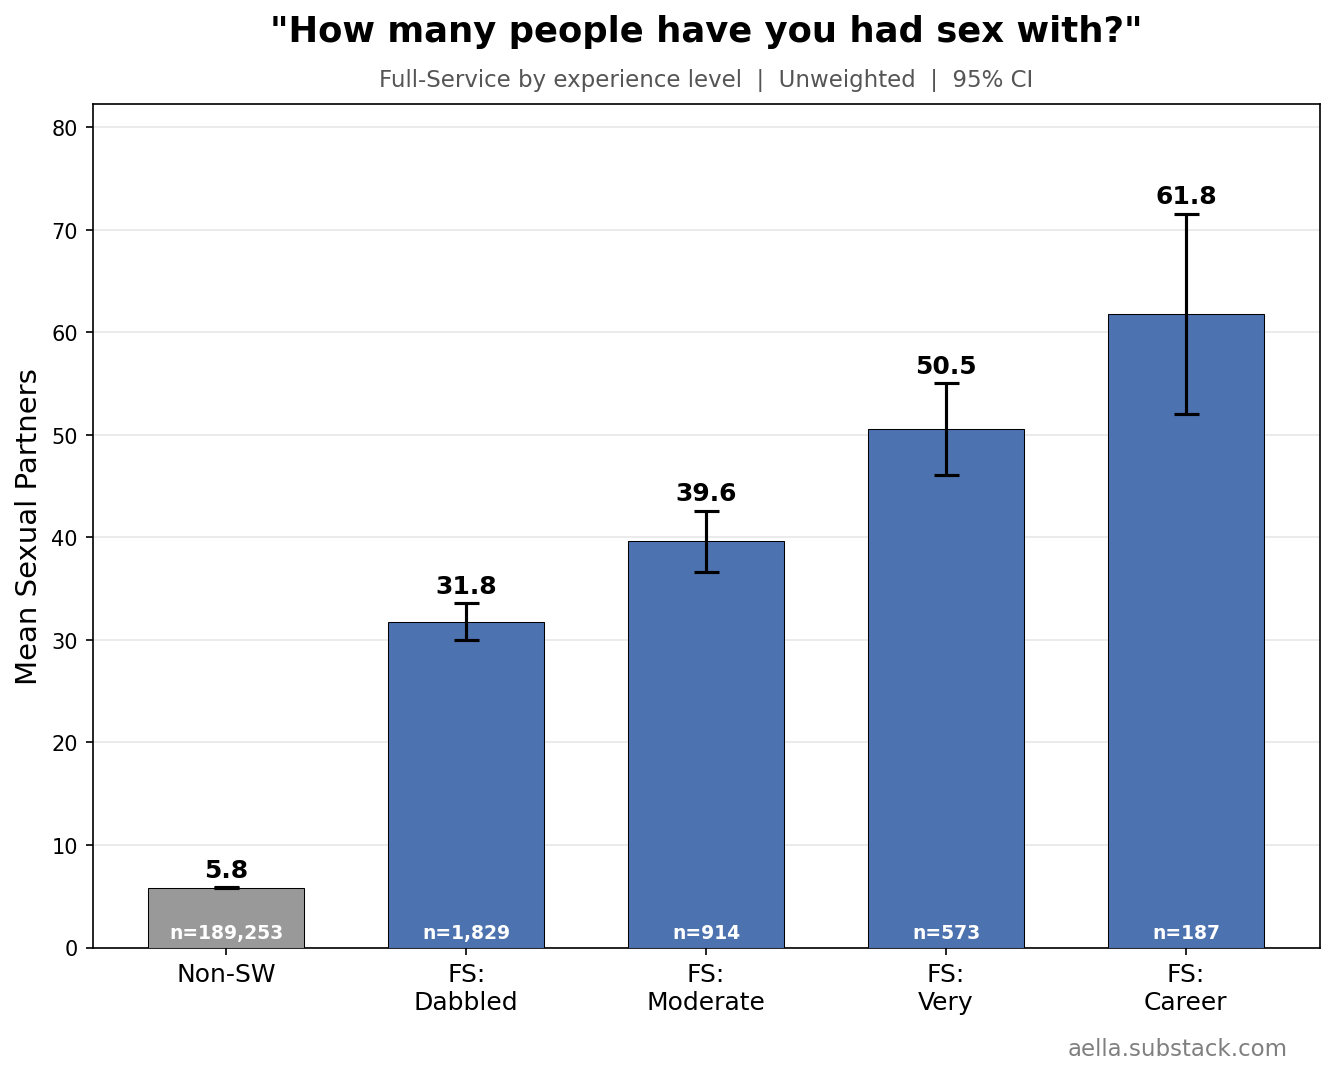
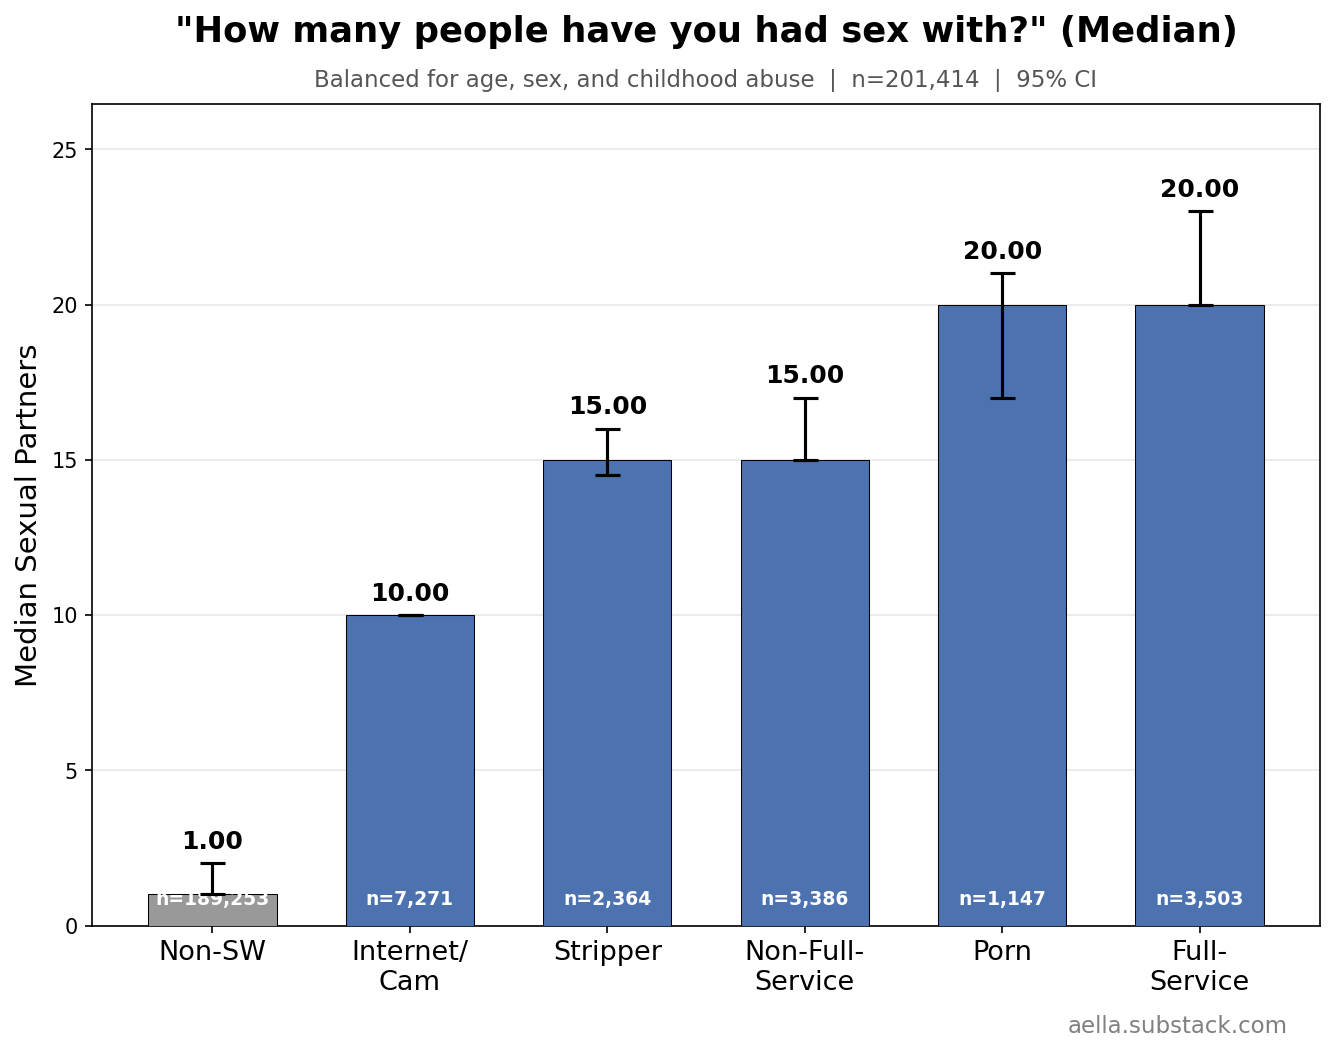
Bodycount:
Checking escorts:
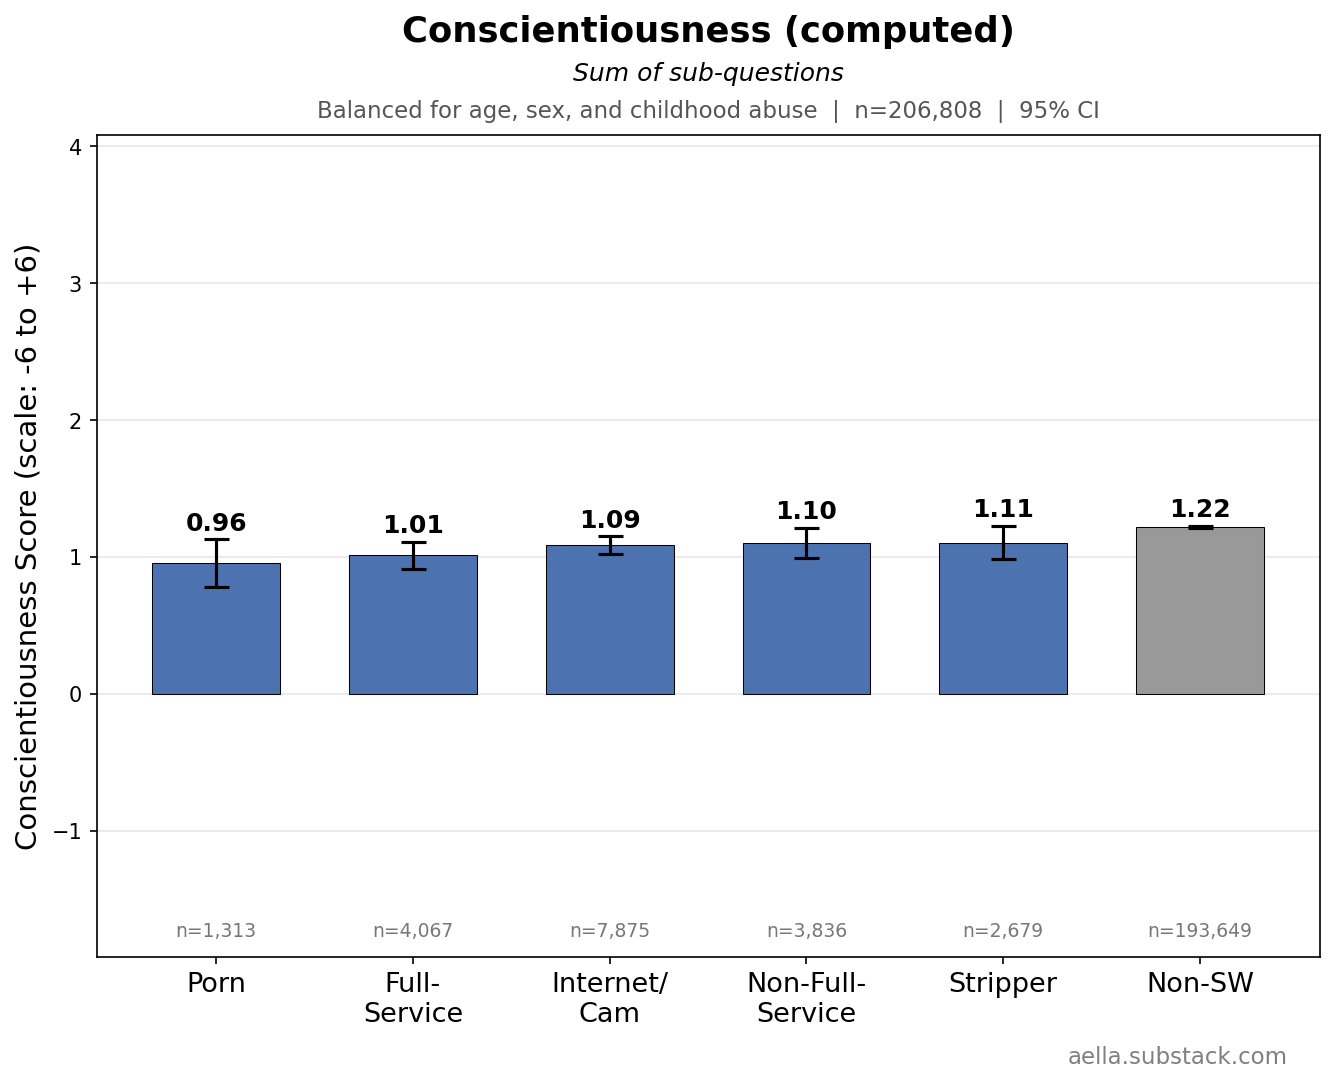
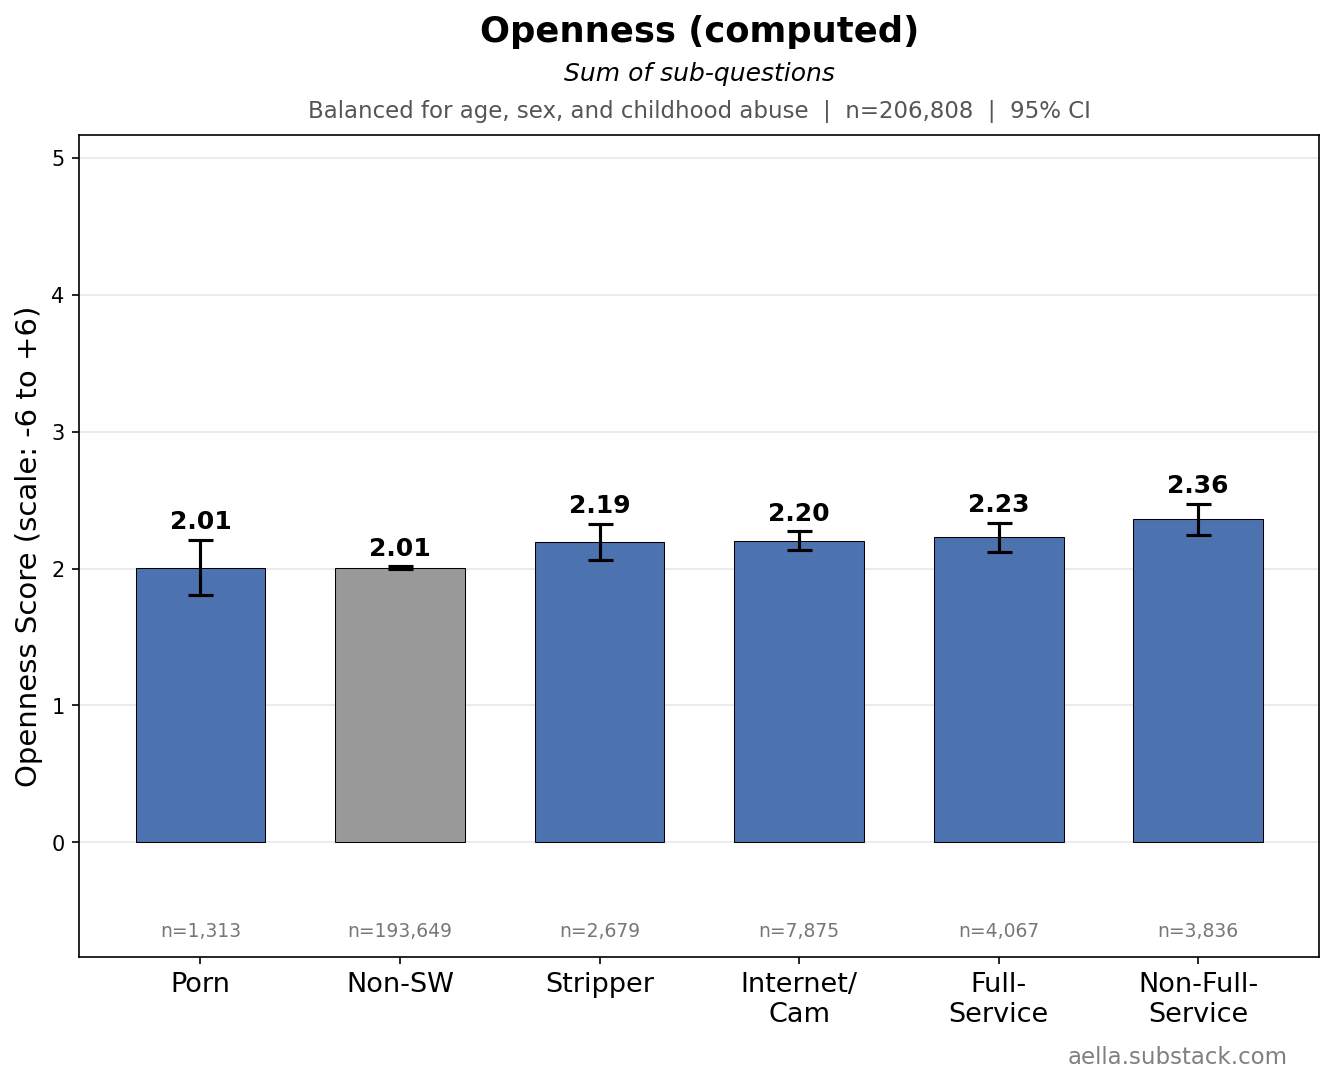
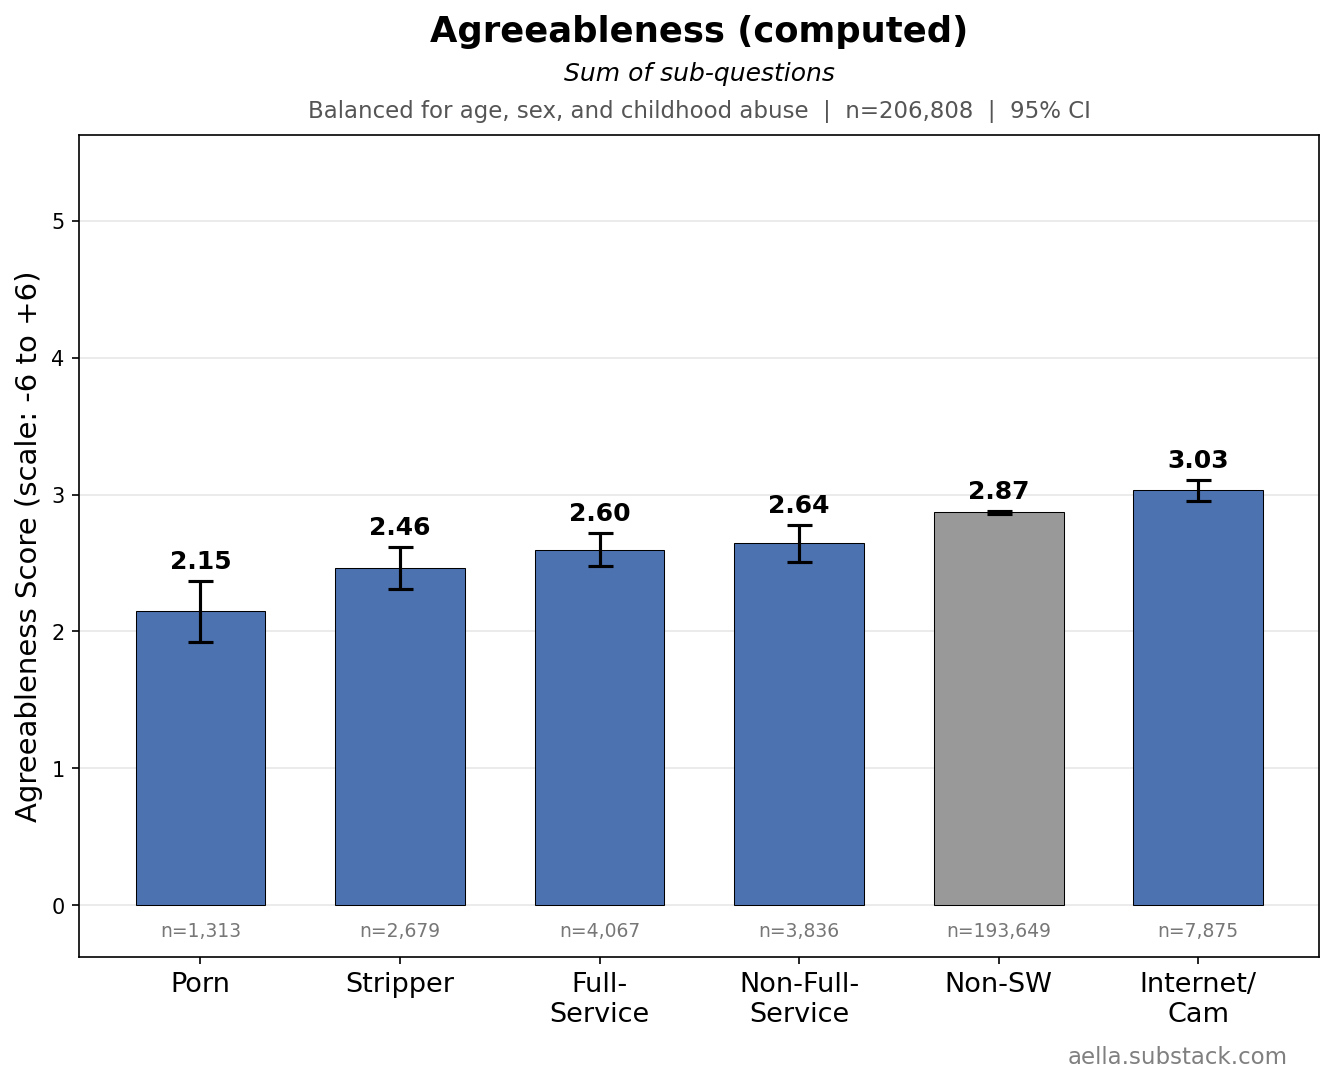
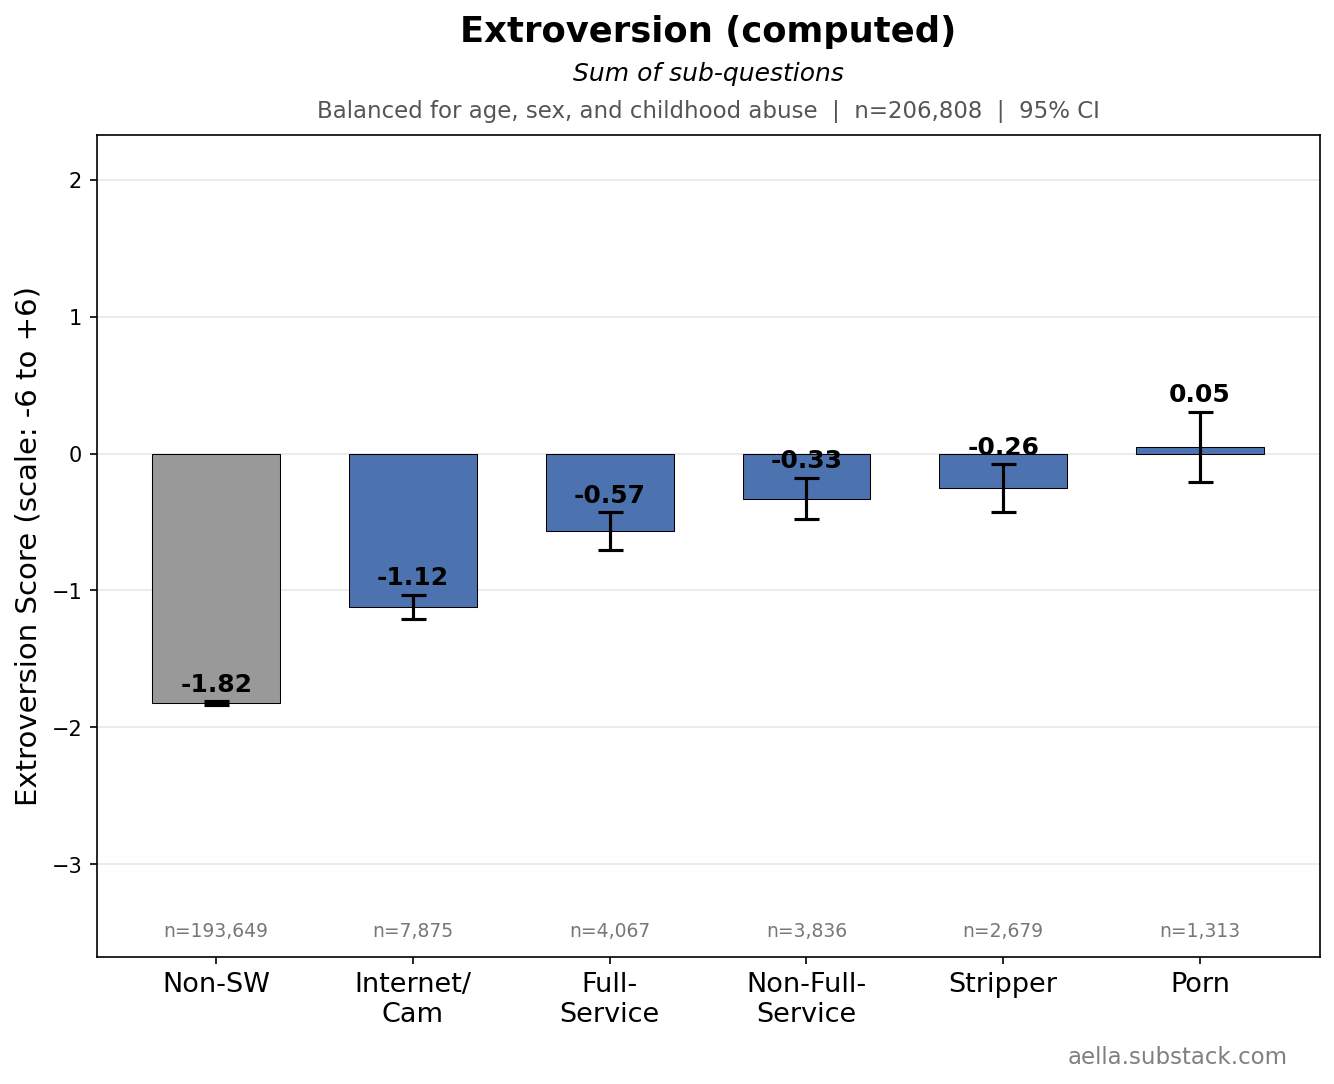
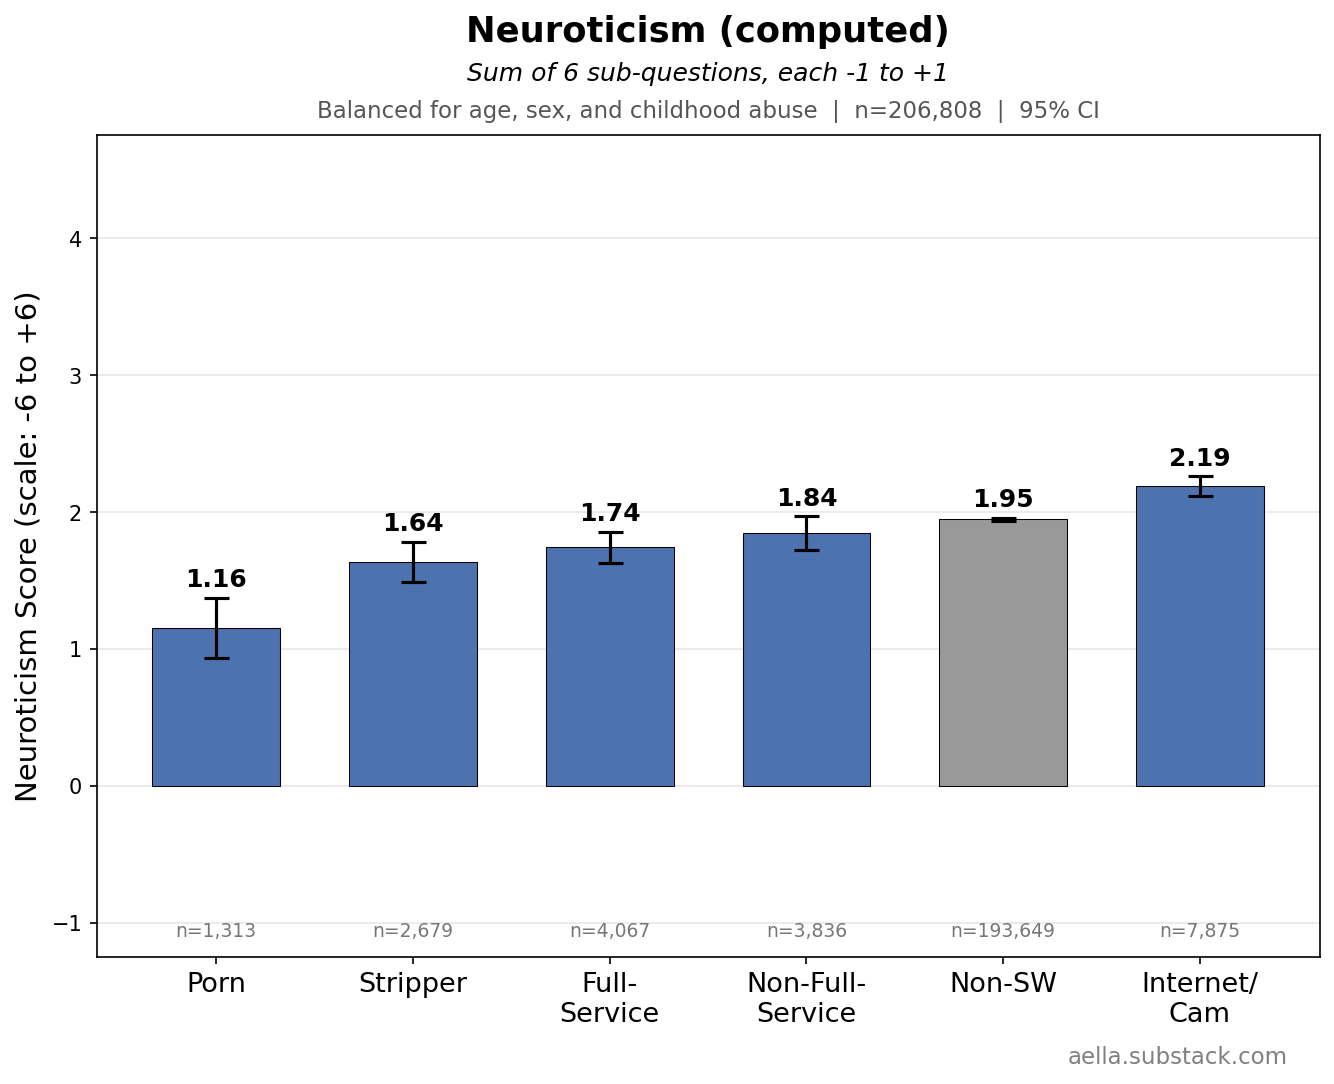
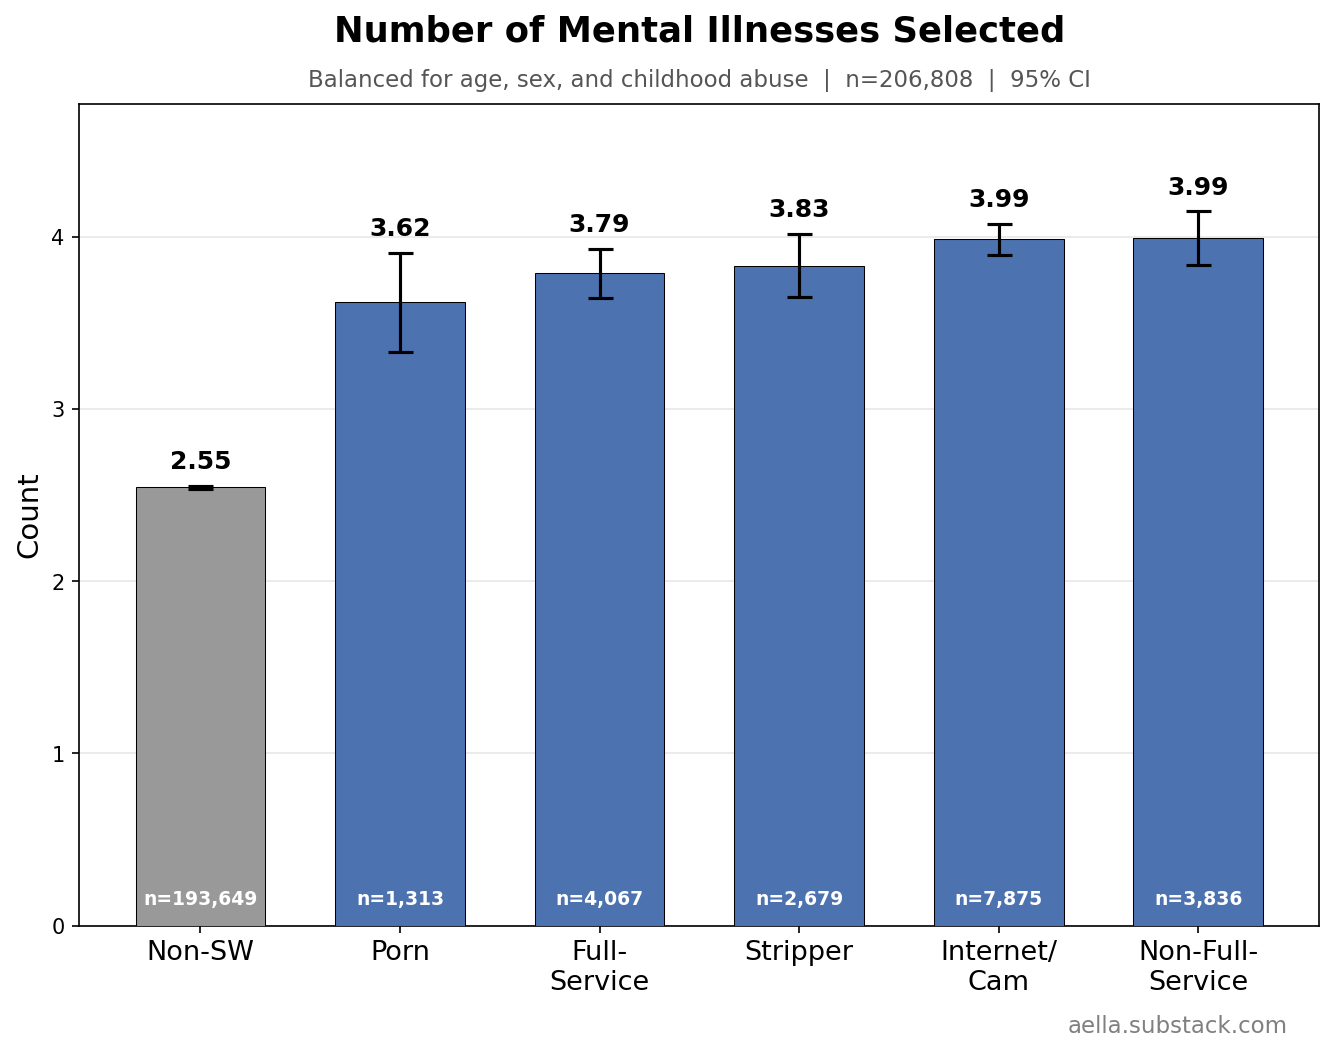
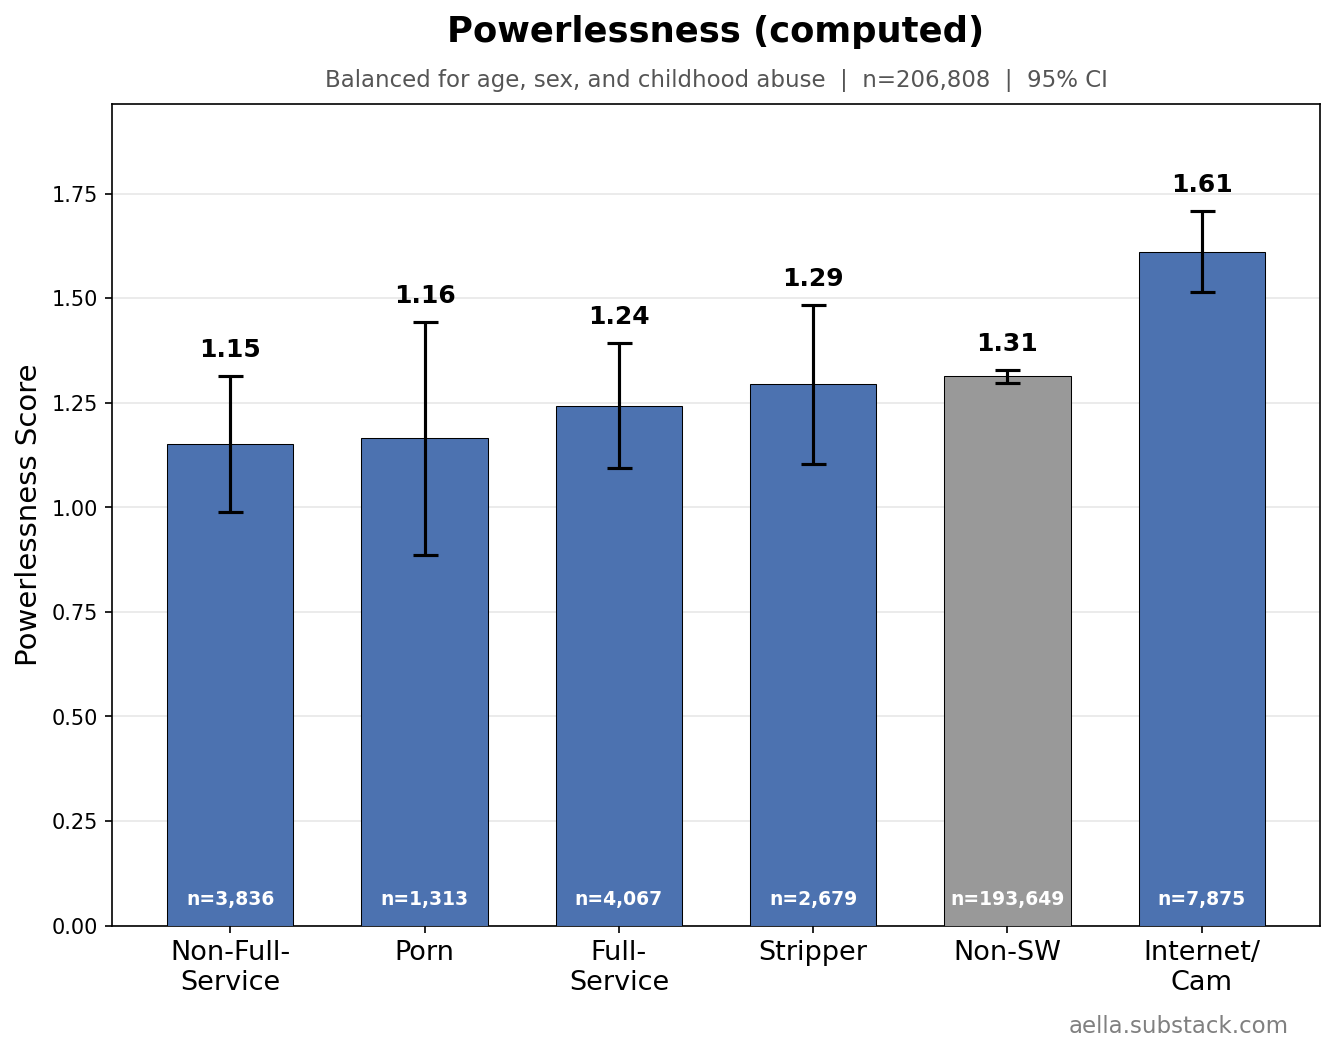
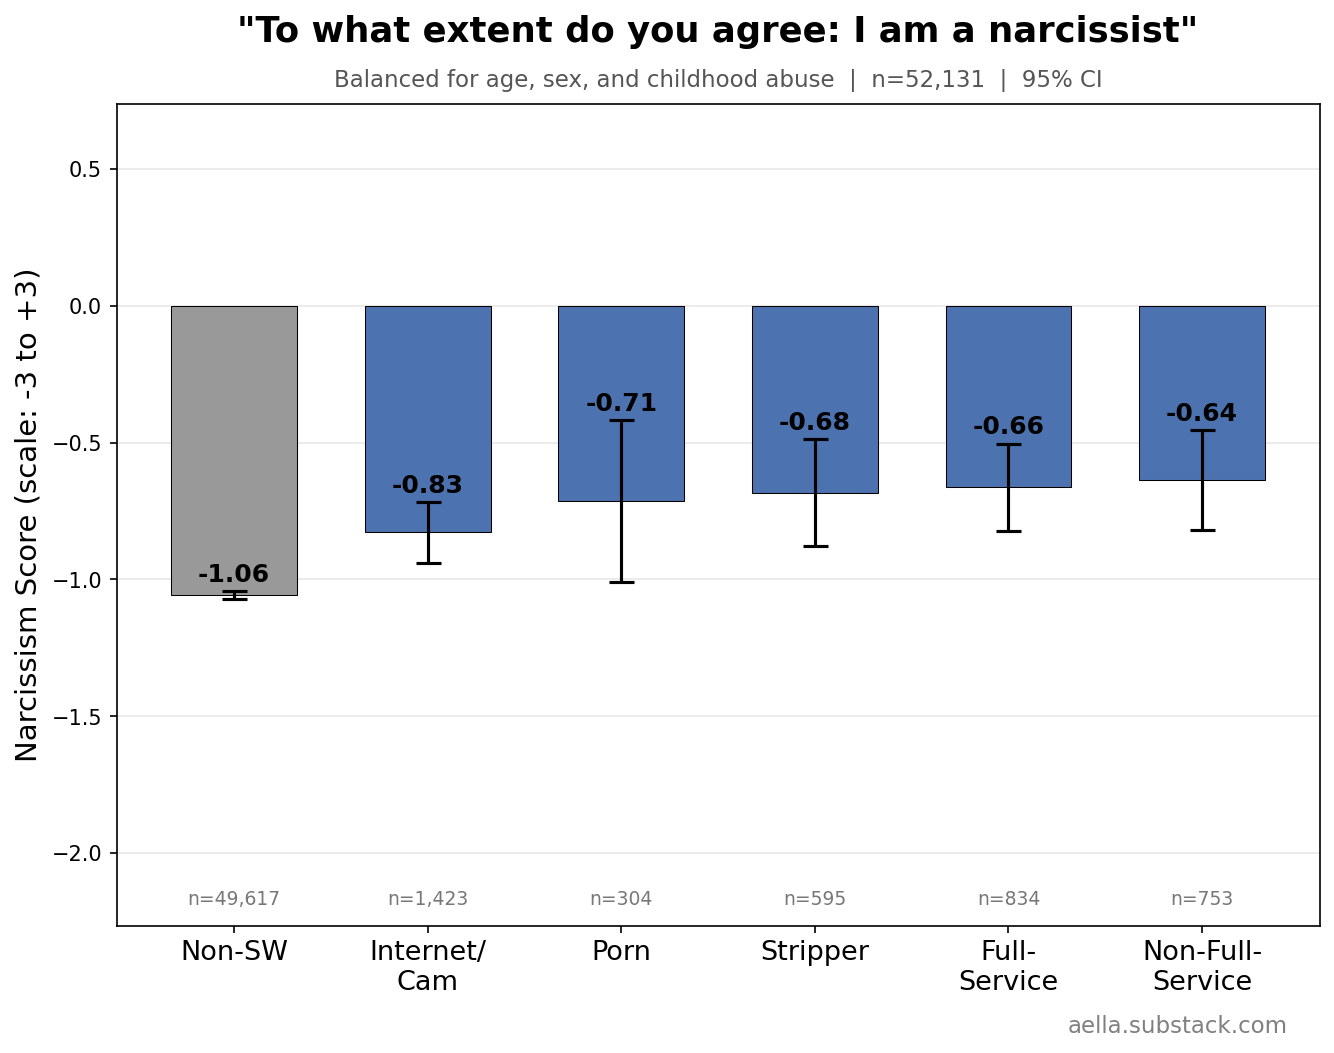
Personality
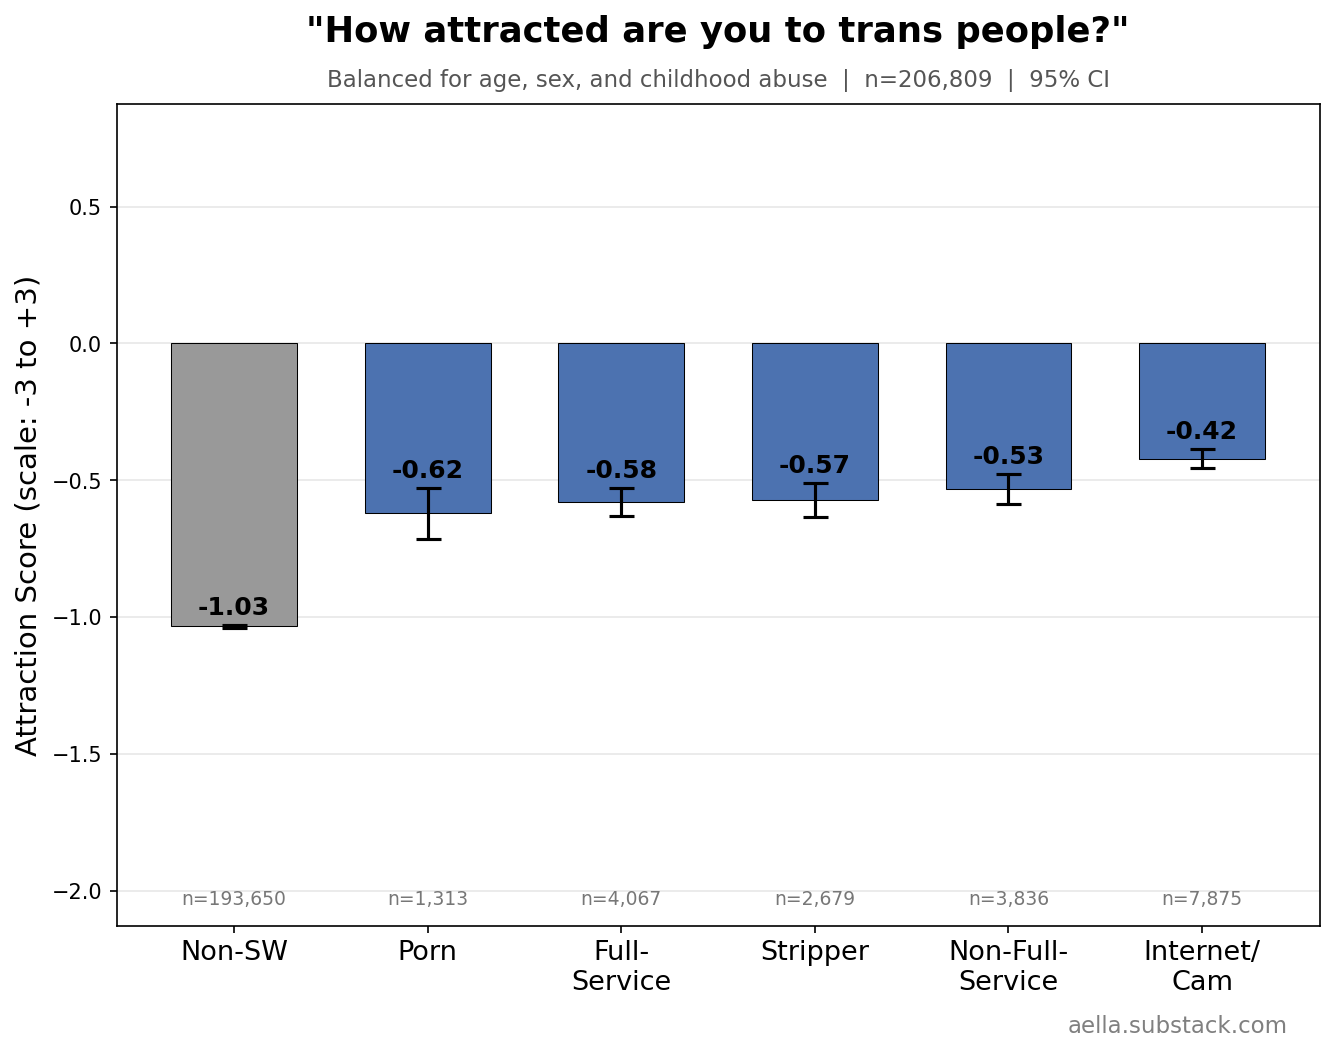
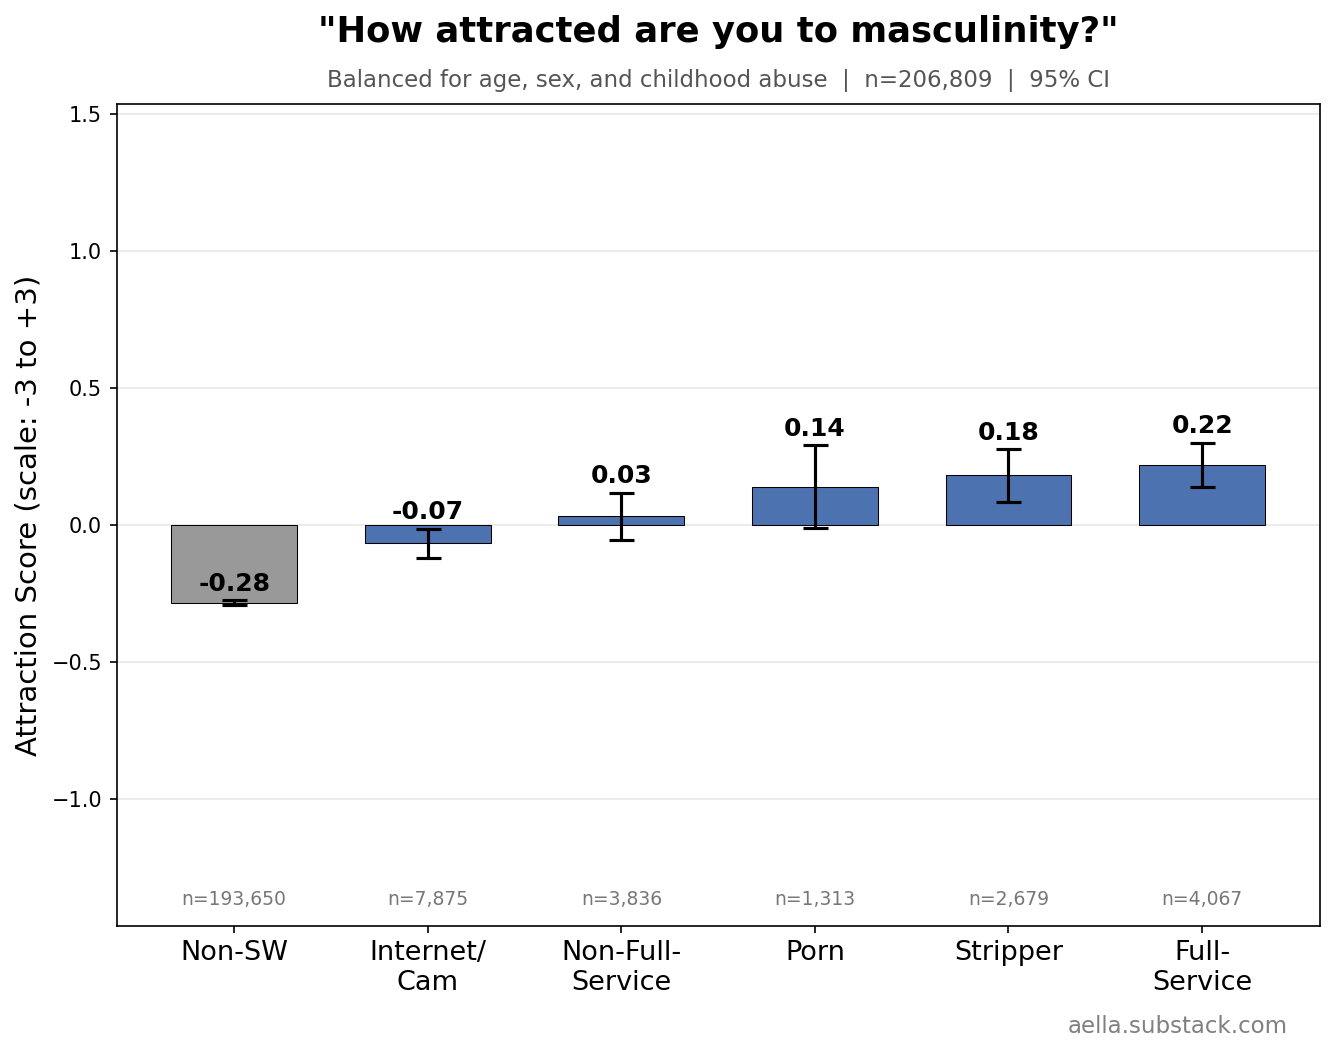
Orientations