In my Big Kink Survey, I asked people for their height and weight. From this, I calculated BMI.
Here’s charts that show relationship between BMI and most of the non-sexual questions I asked about. If you want to get straight to the charts, skip below - but first, who took my survey?
As of writing this, I’m working with n=570,000, down from like 800k or whatever after aggressively cleaning the survey for any suspicious or inconsistent responses, eliminating people who were too young or old, etc.
70% of survey takers were female.
Age distribution was young:
Most people were white, western. Almost all of the survey takers found the survey from some viral tiktoks where people were posting their survey results. I’ve gone into much more depth about how I constructed the survey and the demographics elsewhere.
Anyway, the charts!
I’m just going to dump them all here.
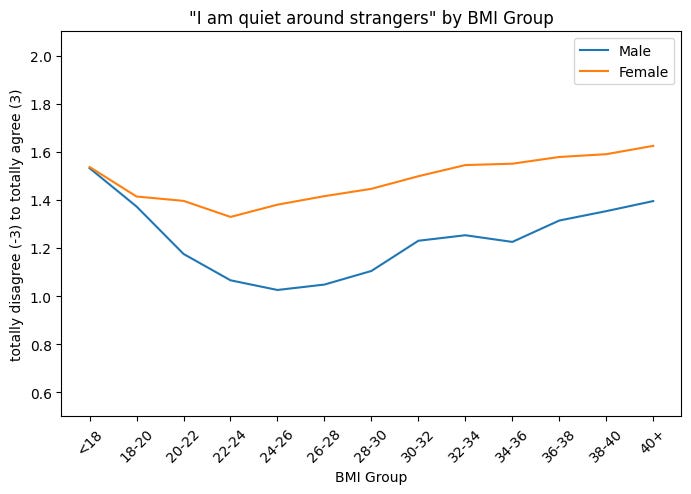
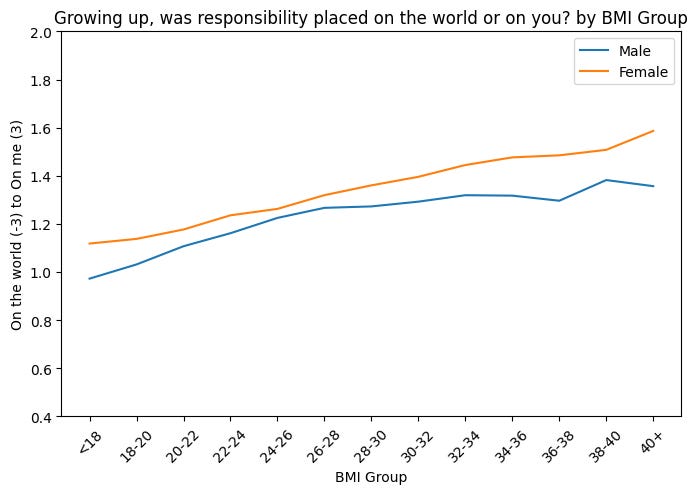
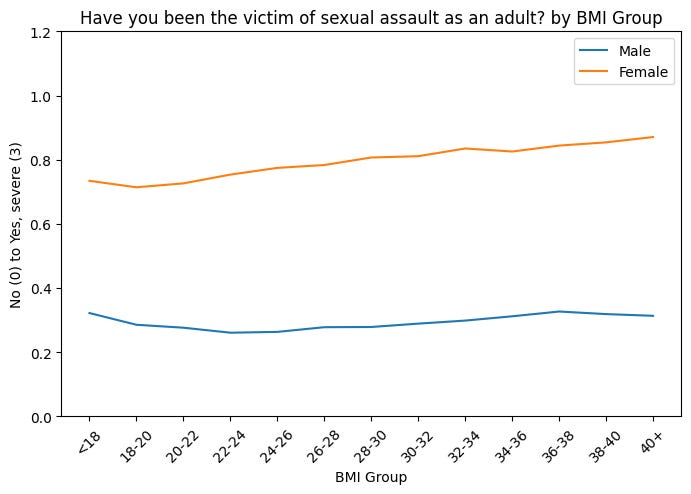
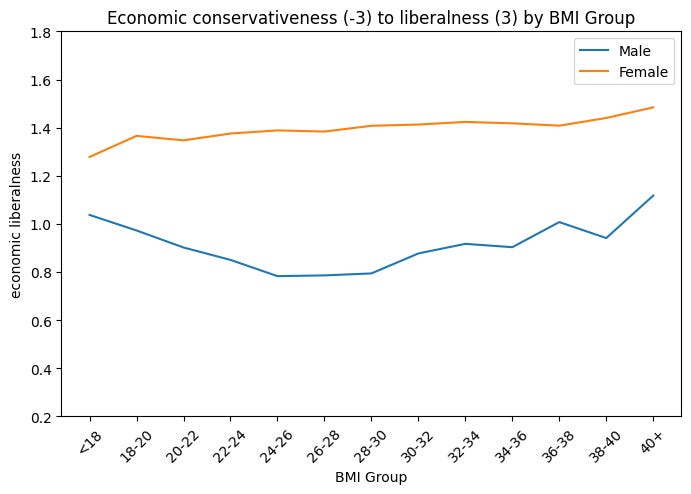
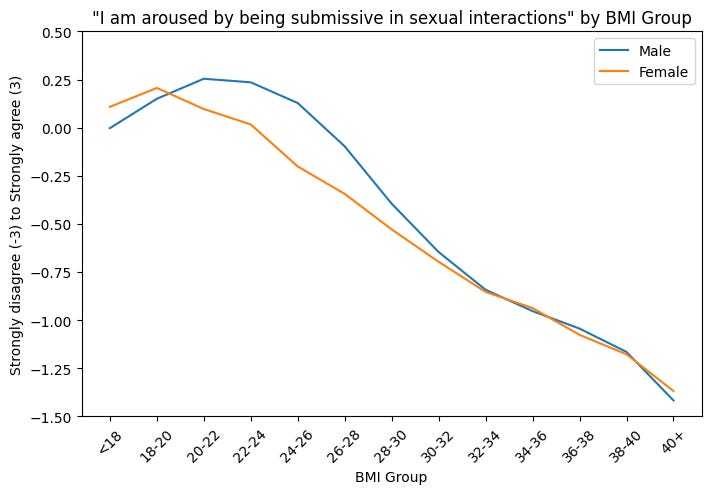
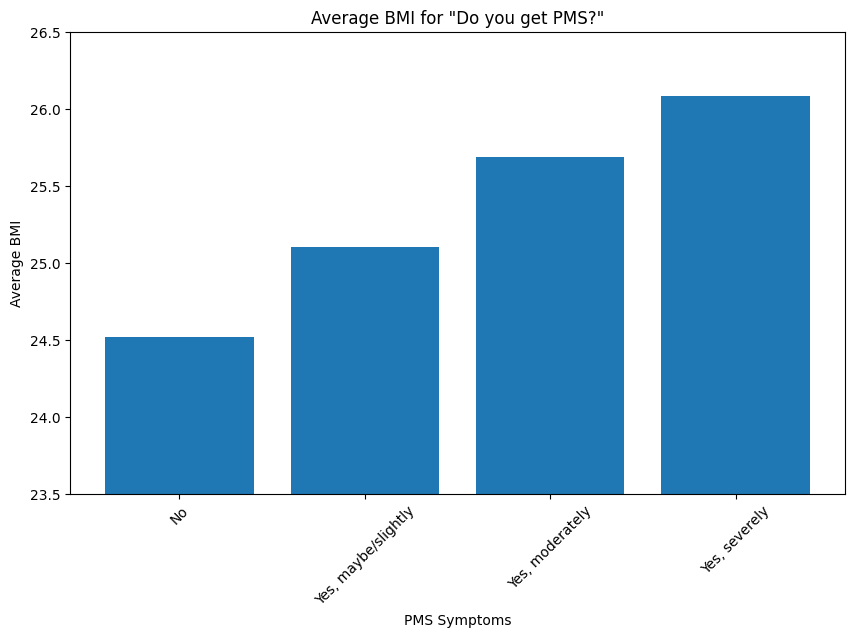
In general, I set the range of the y axis to be roughly one standard deviation of the given question data.
I didn’t control for age (which correlated with BMI in my data at 0.24), but have included some narrower 18-22 age ranges for ones I suspect might be confounded.
Some Big5 Questions:
Measuring power:
Childhood, upbringing, and family
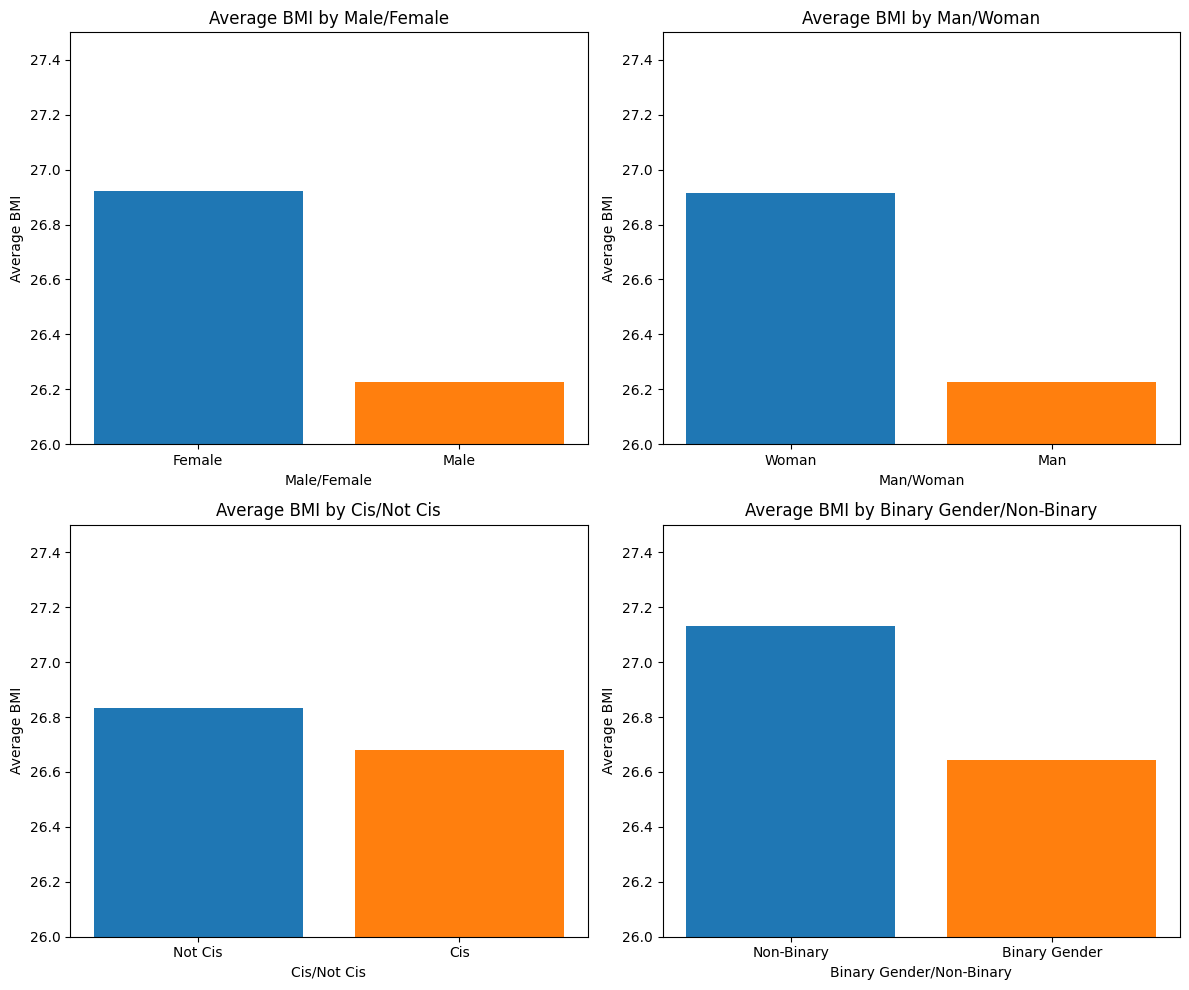
Demographics and Personal Info
Is this confounded by age? Checking a version of this is the graph for only people aged 18-22, it seems to be basically identical:
Etcetera.
Sexual Assault
These are just the straight graphs; I’m not bothering with trying to interpret them right now, I’ll leave that up to you and might try my hand at some theories in a later blog post.













Looks like high BMI correlates with a lot of people things related to class (income and spanking were especially noticeable)
That correlation between social status/wealth upbringing and responsibility upbringing though... oof!